Dashboard Overview
The dashboard is the first screen after login and summarizes activity for the selected product preference.
Data Reality Dashboard Instructions
This document provides a comprehensive overview of the Data Reality Dashboard. The dashboard is designed to offer a quick and thorough pulse check on product performance, risk, and compliance. The high-level view allows users to efficiently drill down into specific areas of concern, facilitating proactive decision-making.
Critical Indicators
Begin by reviewing the Data Reality Dashboard, which provides an immediate pulse check on product performance, risk, and compliance. The top section features three critical indicators: events, serious injuries, and malfunctions. These indicators provide a high-level overview that allows users to quickly identify areas of concern.
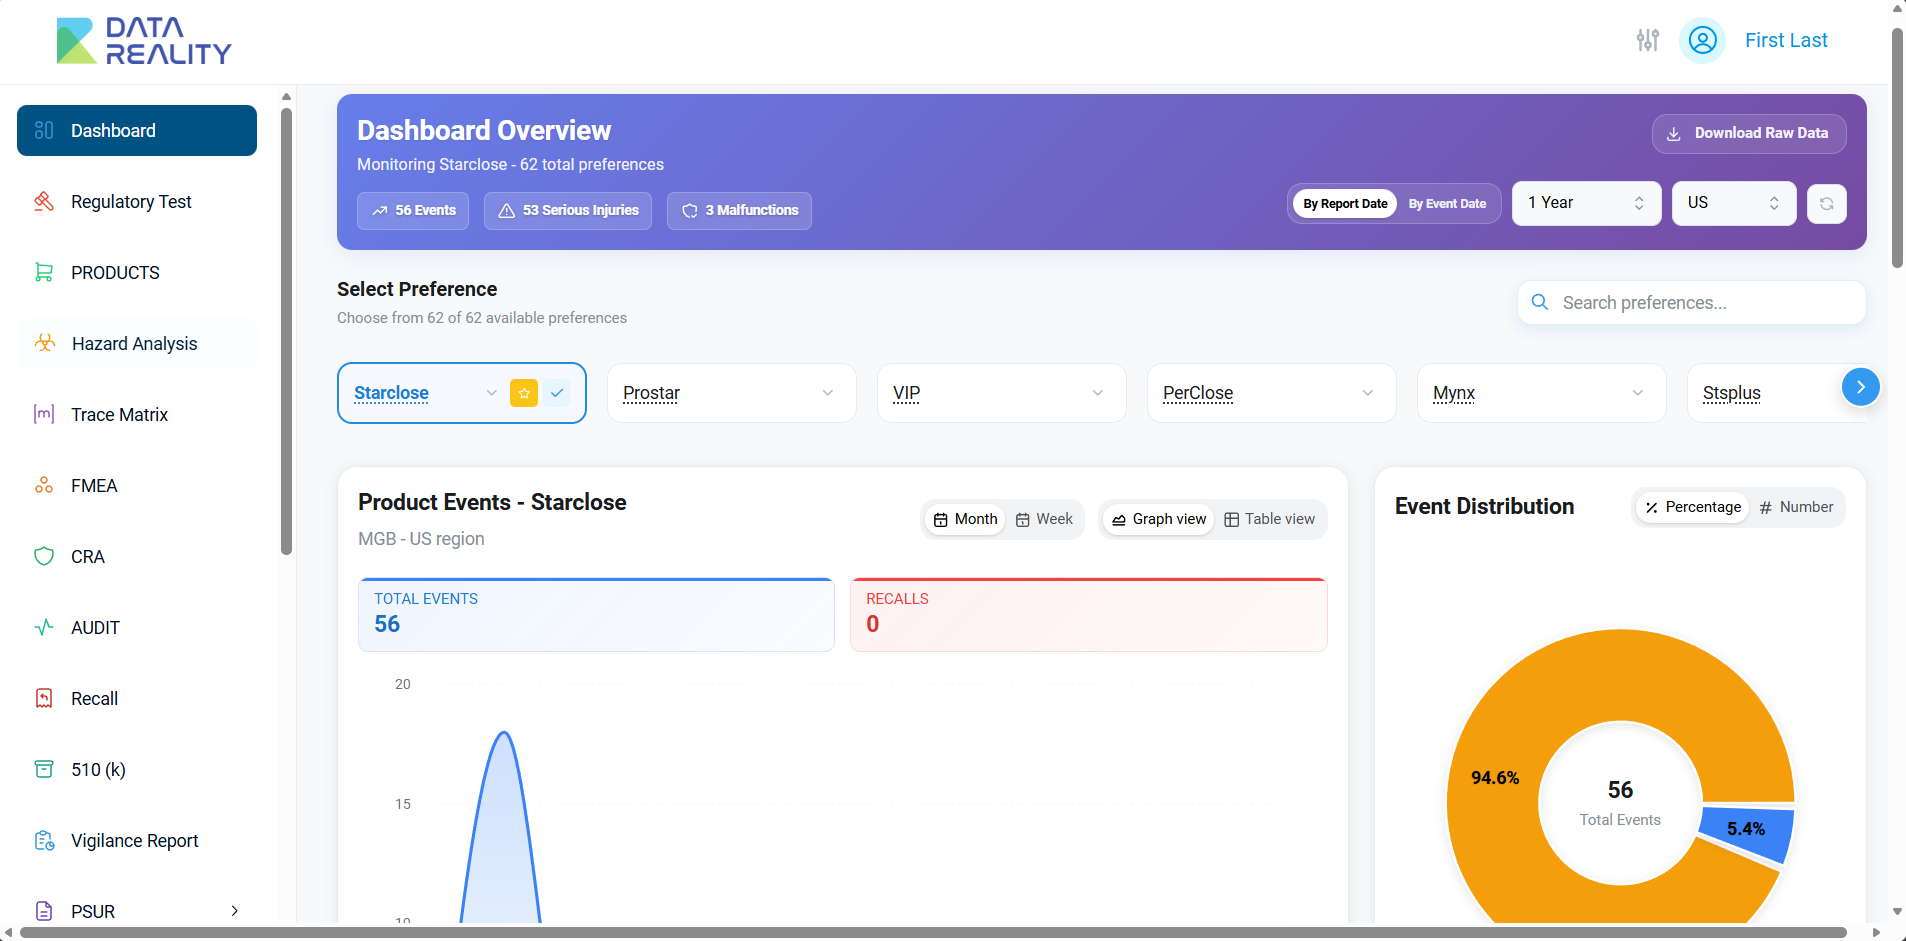
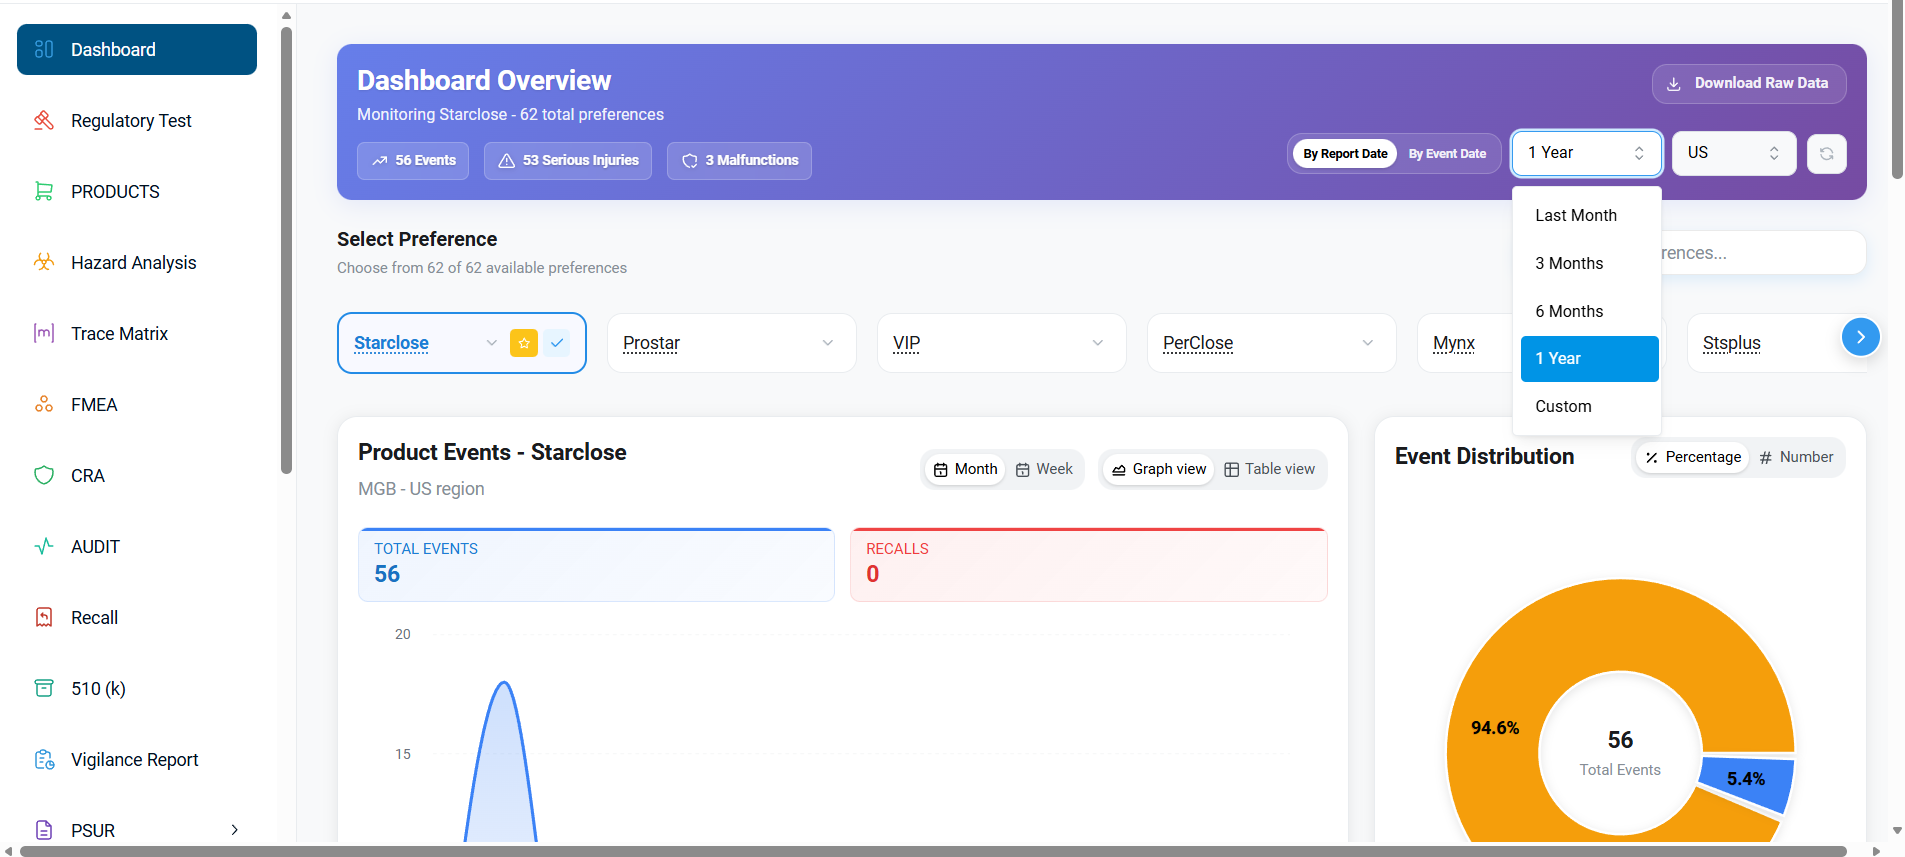
Executive Summary
The dashboard features an executive summary, presenting key metrics that pinpoint current risks. These indicators are categorized into two sections: by report date and by event date. Additionally, users can toggle between timelines, such as last month, three months, six months, and a year.
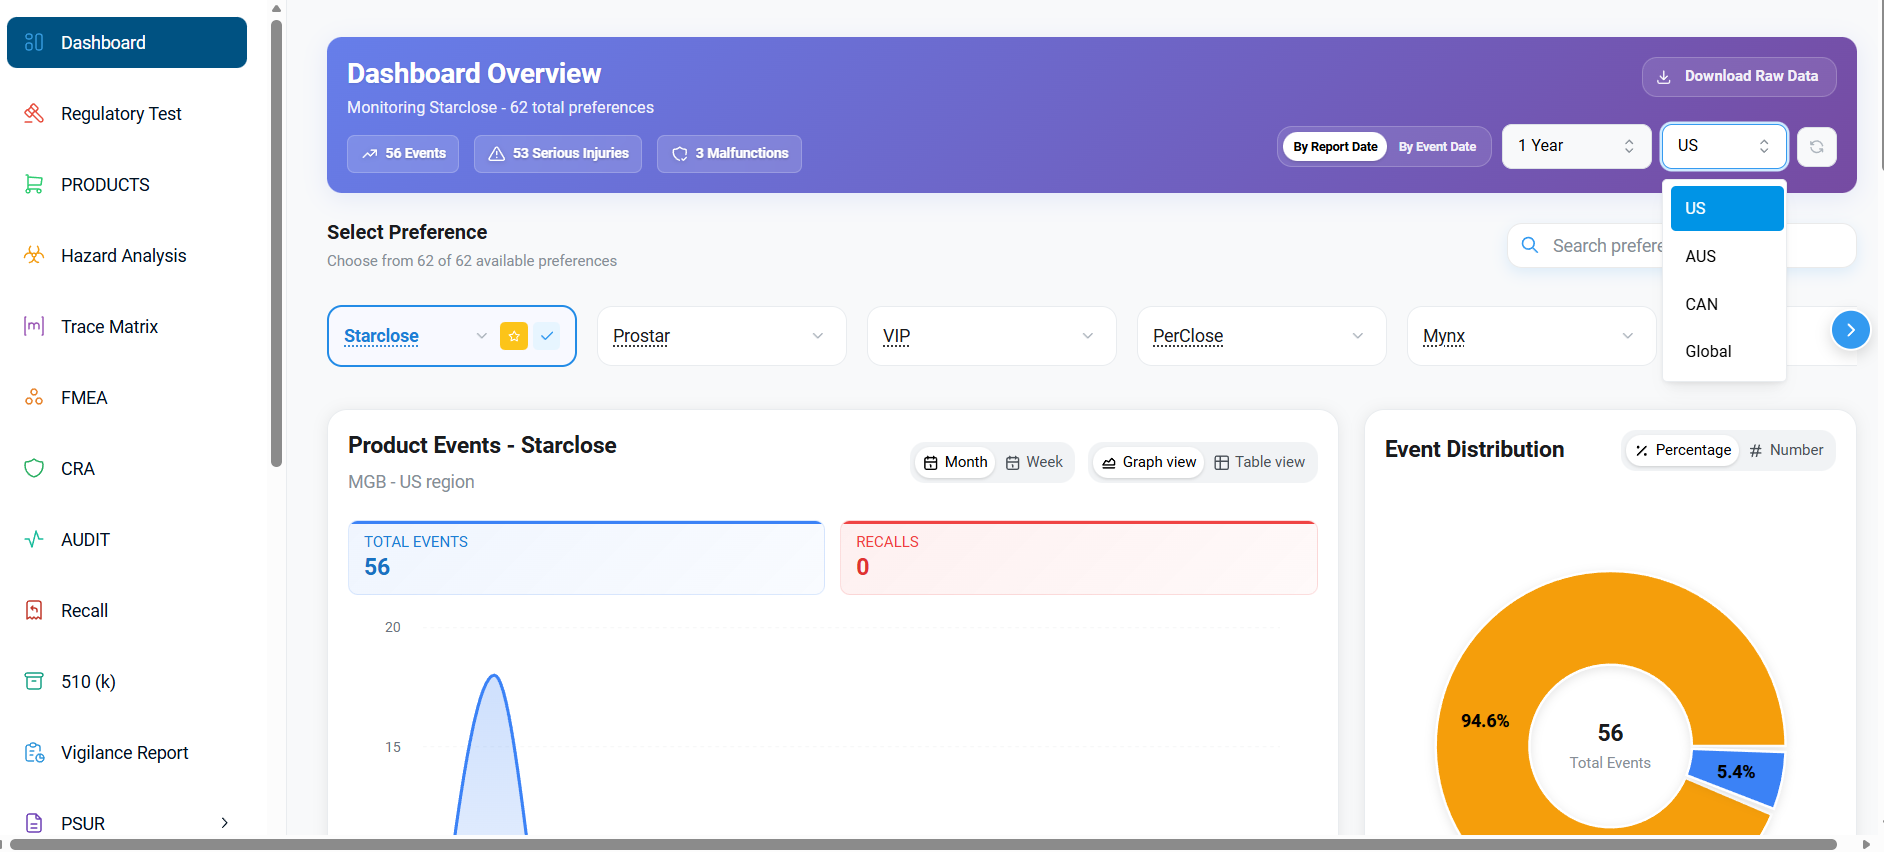
Region Selection
The dashboard includes an option to change the country setting. Users can switch between the US, Australia, Canada, and global settings as needed.
Product Preferences
Below the main section, you will find the Select Preferences day toggle, which offers 62 available preferences. Options include Star Close, ProStar, VIP, Per Close, mynx and other available preferences.
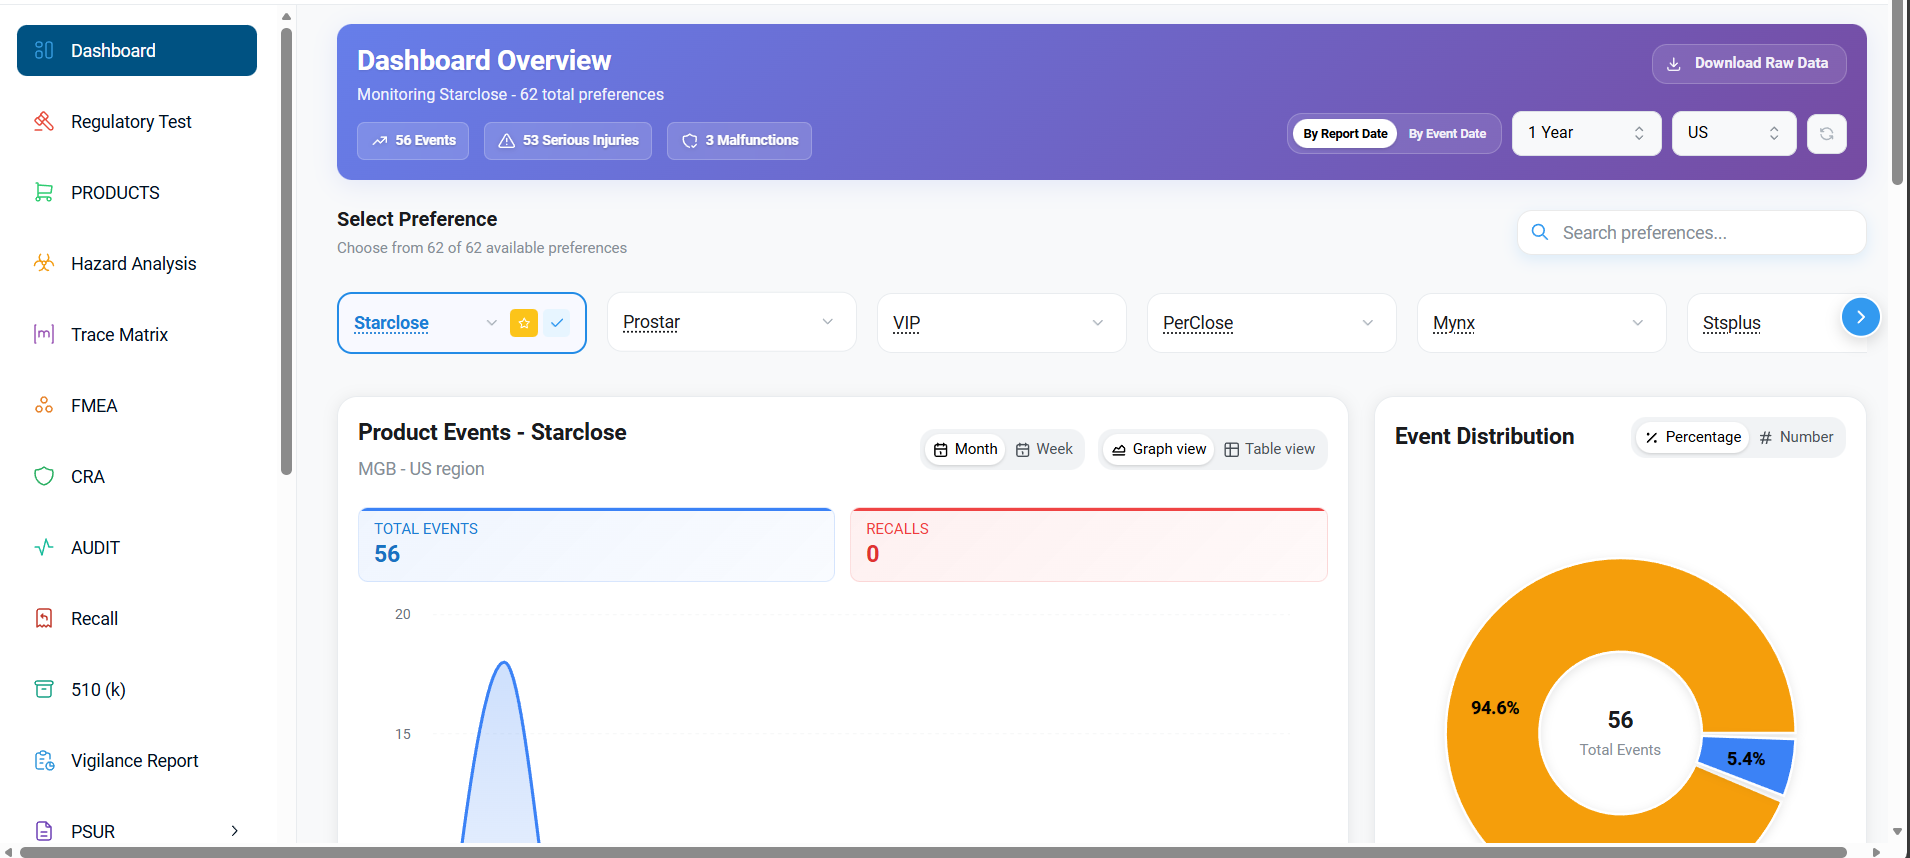
Event & Recall Trends
Starting with Star Close, this section provides detailed insights into total events and recalls, categorized by month and week. Users can choose between a graph view and a table view.
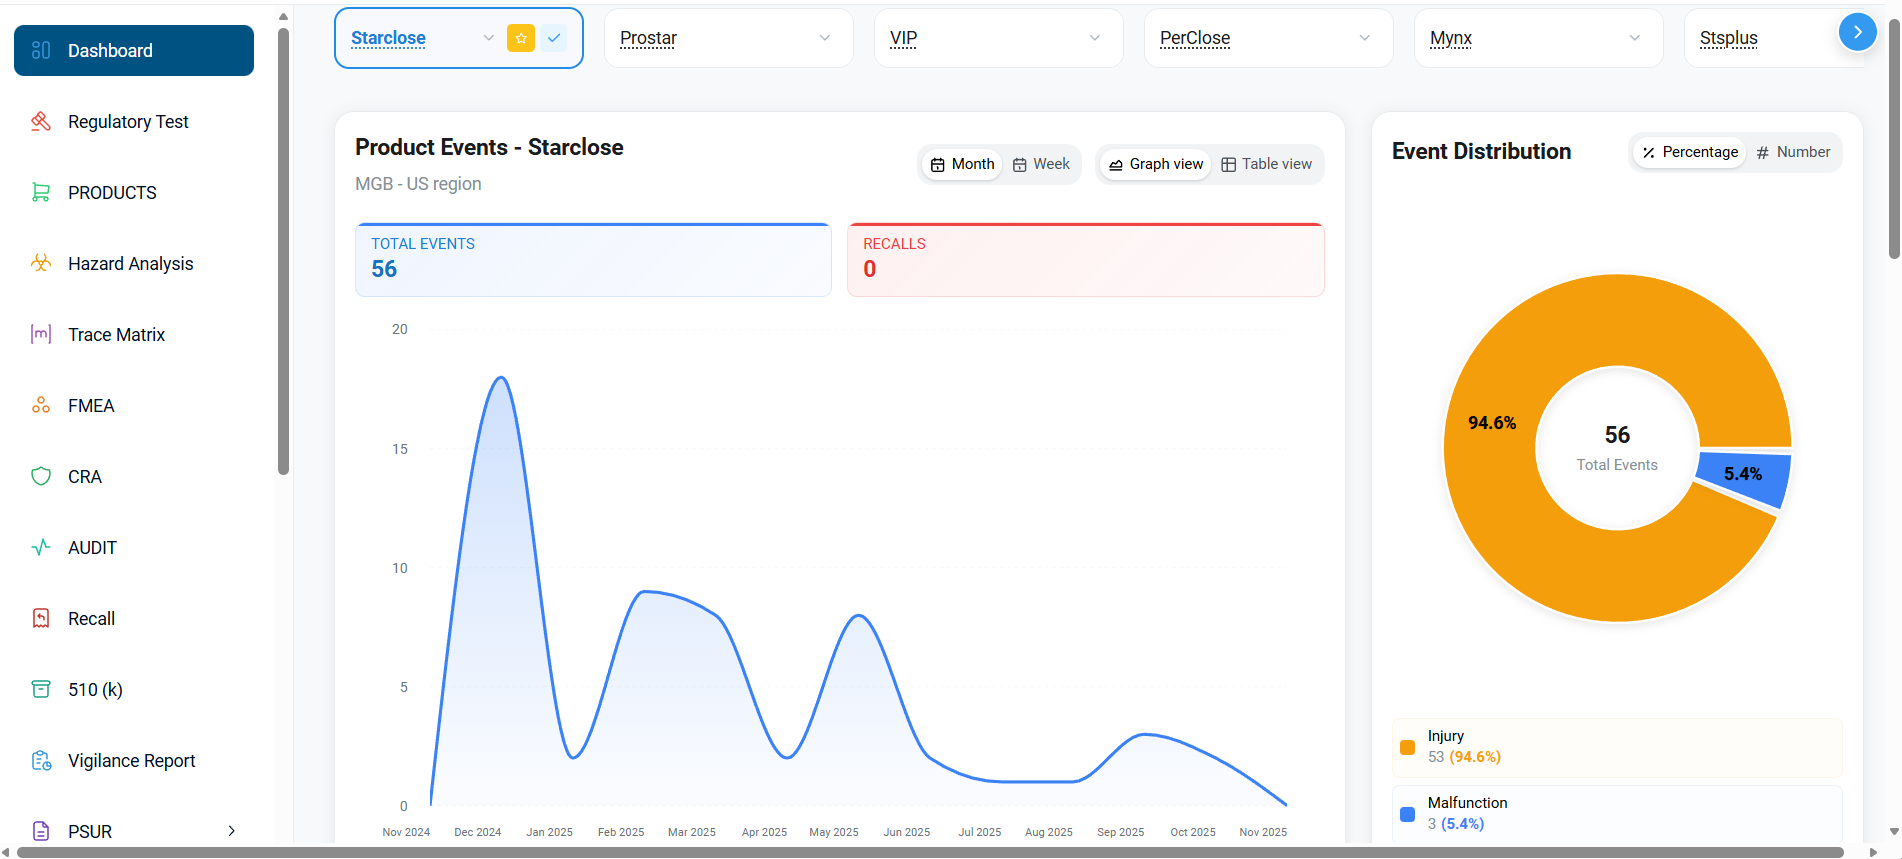
Graph Categories
In the graph view, events can be categorized further. For instance, data from December 2024 on total events, injury deaths, and malfunctions can be viewed alongside data from May 2025 for comparison.
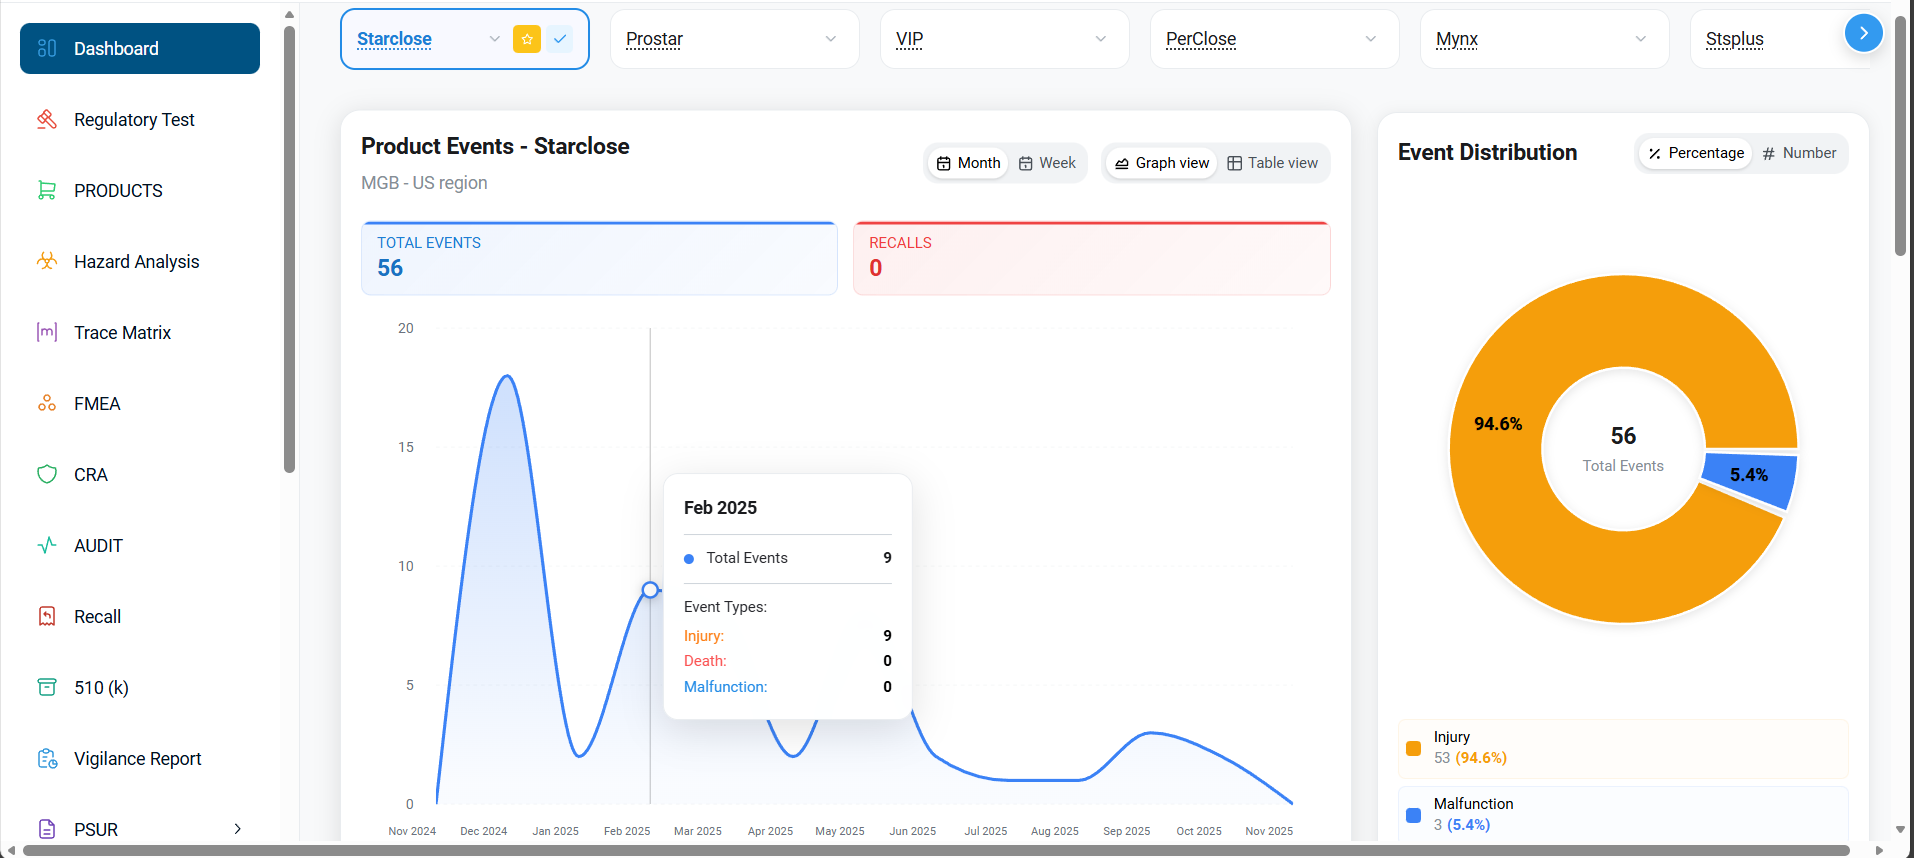
Table Distribution
Switching to the table view, users can access detailed listings of accessories and formats. Additionally, the view includes even distribution data, displayed both by percentage and by number.
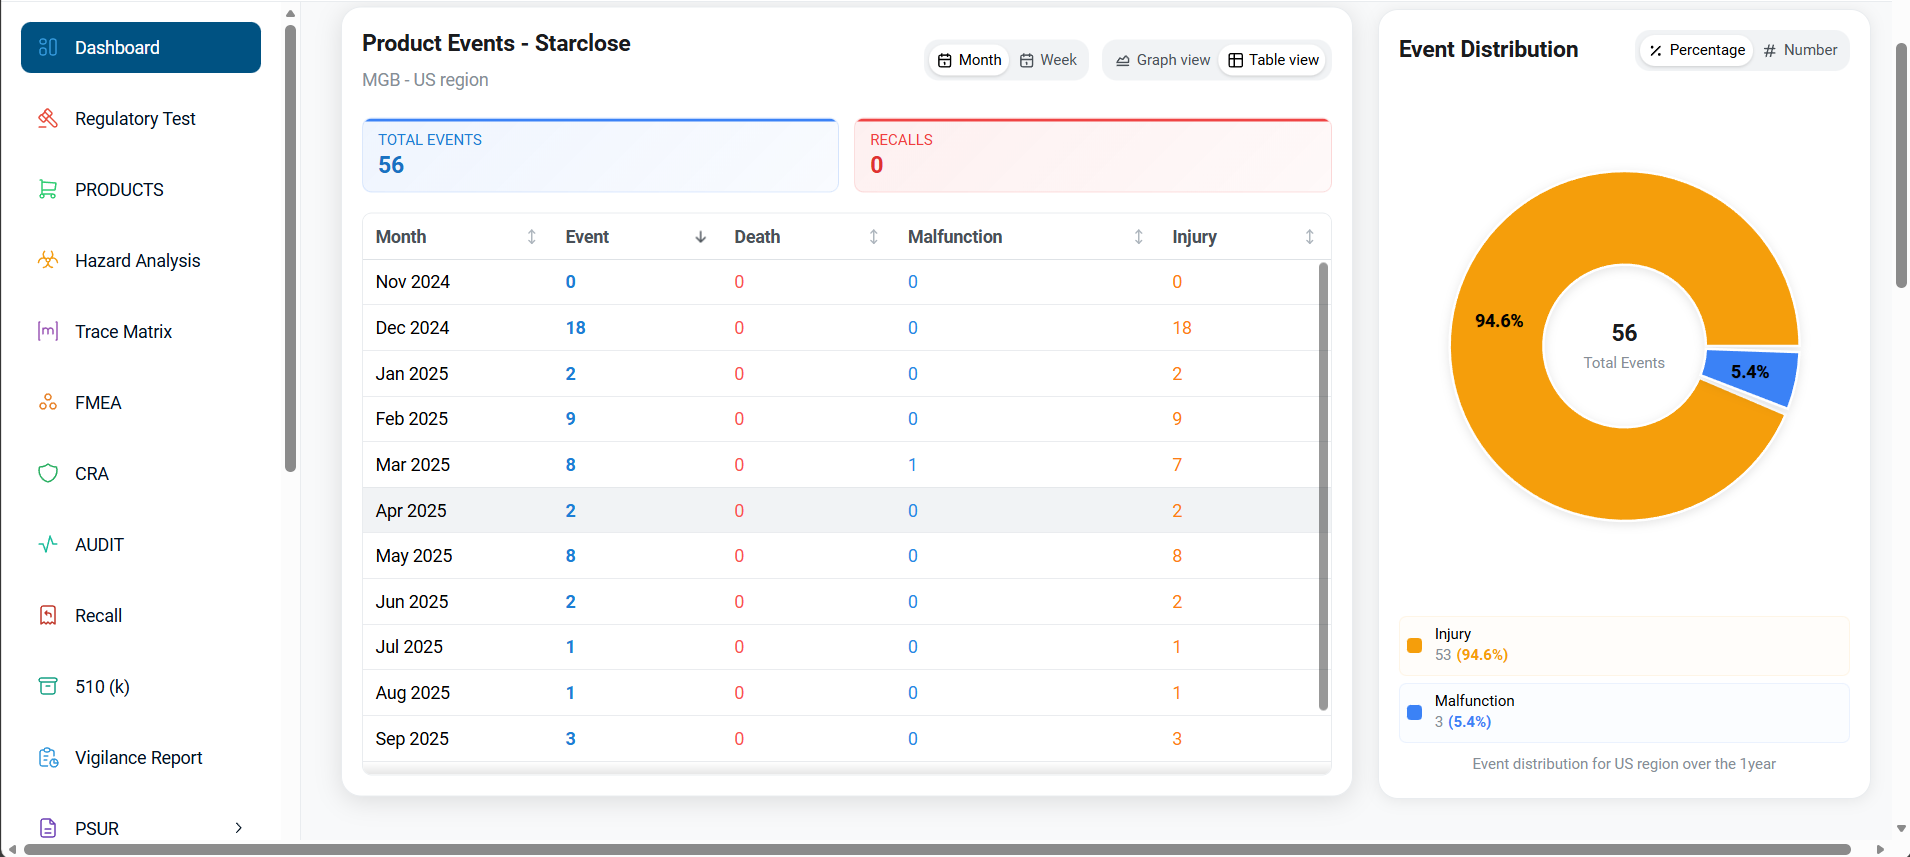
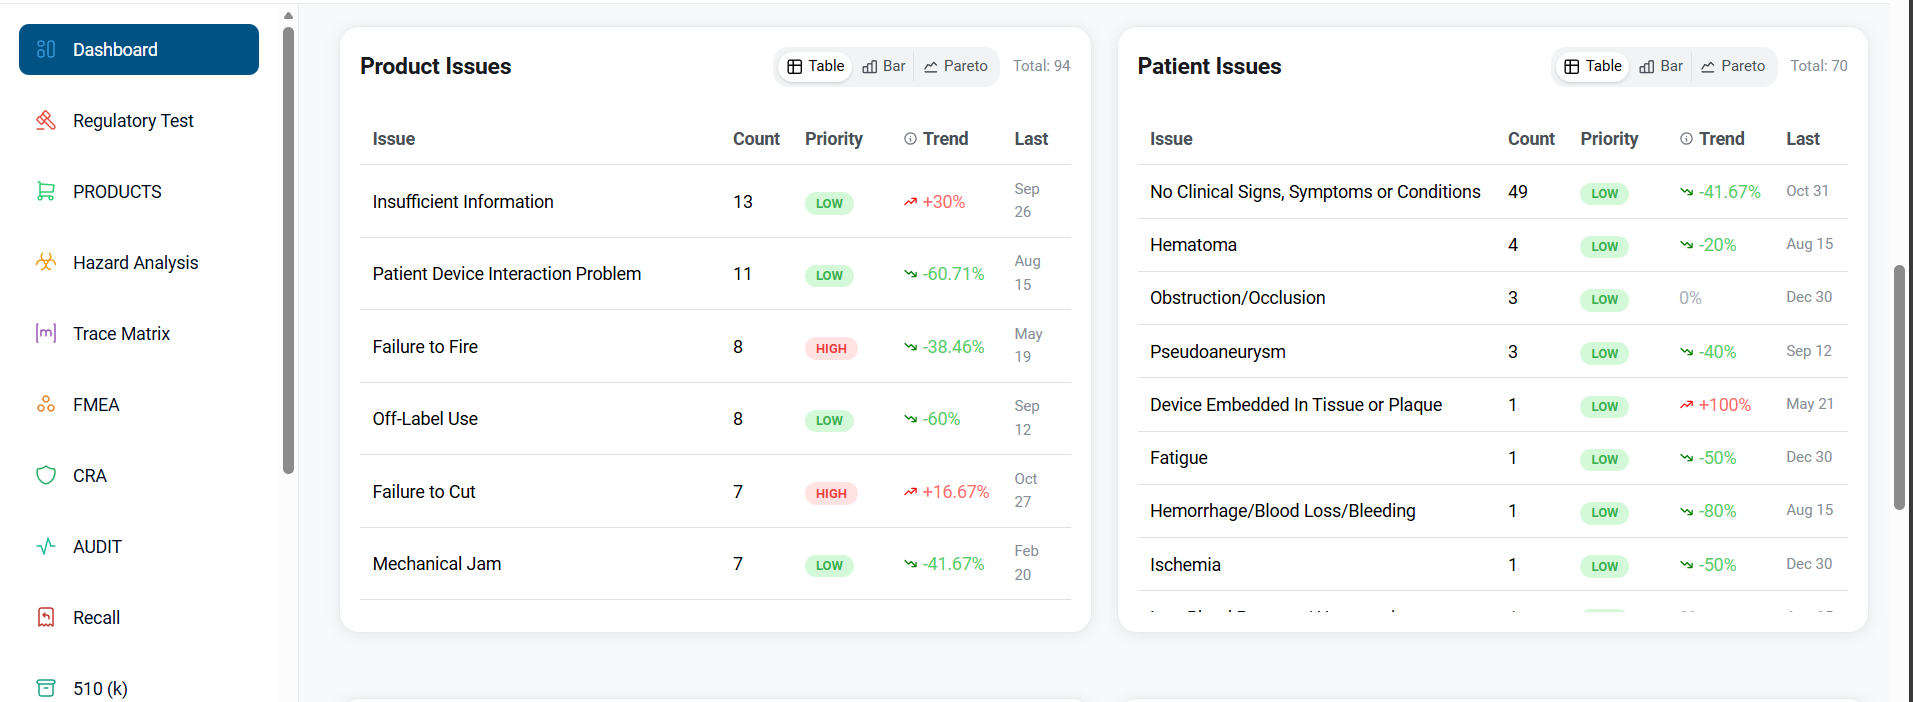
Detailed Breakdown
The percentage view highlights total events, injuries, and malfunctions. In the numerical view, detailed breakdowns of these categories are available. The section also identifies product issues, facilitating targeted investigations.
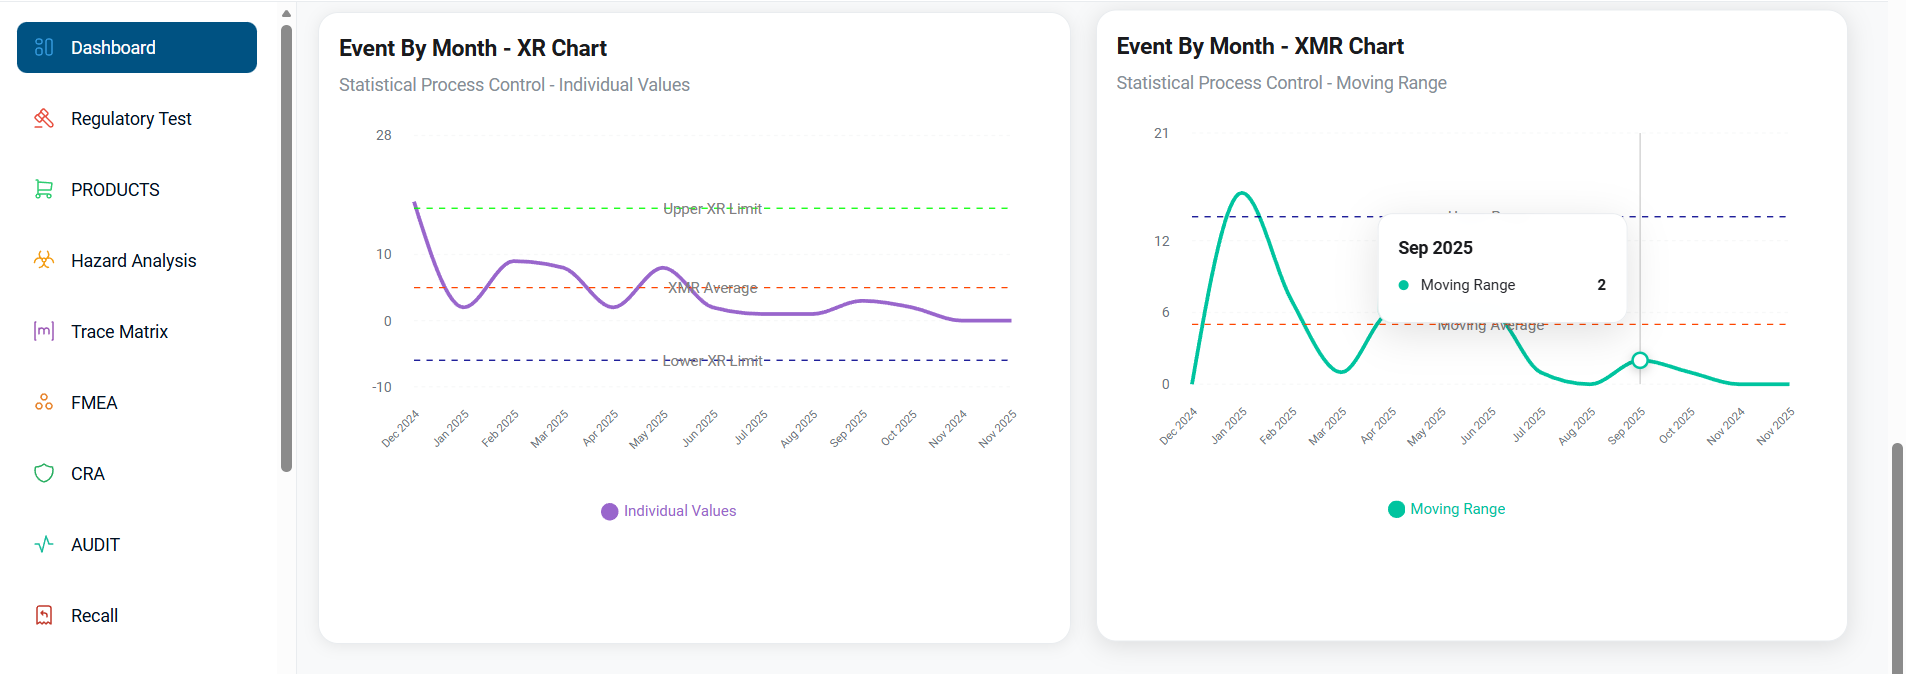
Stability Charts (XR/XMR)
The XR chart shows the monthly individual event values compared against upper and lower control limits to assess process stability, while the XMR chart displays the month-to-month moving range to highlight fluctuations in event counts; together, they help identify unusual spikes, drops, or variations, ensuring the overall process remains within normal control limits.
Metrics
- Events: count of all reported events in the selected window.
- Serious Injuries: events marked with serious patient outcomes.
- Malfunctions: device malfunction incidents linked to the preference.
Filtering controls
- By Report Date: filters by the date a record was reported to the authority.
- By Event Date: filters by when the event actually occurred.
- Time window presets:
1 Year,6 Months, or a custom range. - Region: choose
USorEUto scope metrics.
Use the header controls to switch between date anchors, adjust timeframes, and focus on regional trends.