Selecting Your Product
The Product Selection interface is the control center for defining the scope of your analysis. It allows you to filter the vast DataReality dataset down to the specific devices, timeframes, and regions relevant to your current investigation.
Follow the sequence below to configure your analysis context.
1. Establish Your Search Criteria
When you first access the selection screen, you will see a clean interface ready for your inputs. The workspace is divided into temporal (time) and categorical filters.
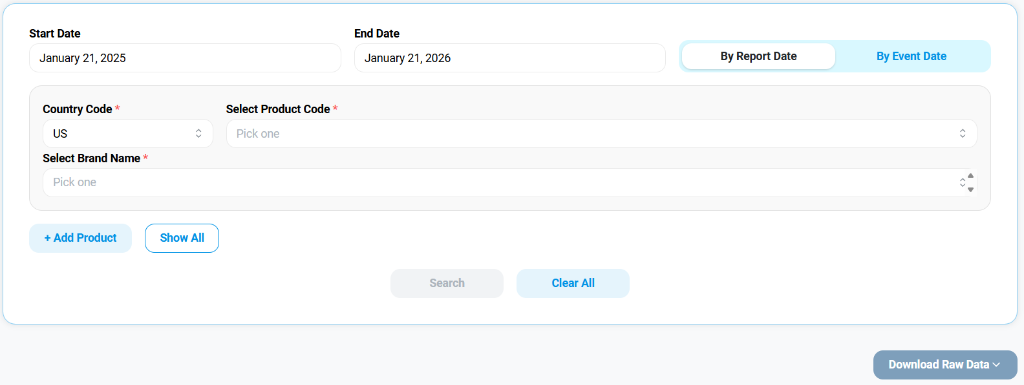
- Date Range: Set the
Start DateandEnd Date.- By Report Date: Filters based on when the adverse event was reported to the regulatory body (e.g., FDA).
- By Event Date: Filters based on when the actual incident occurred.
- Country Code: Defaults to
USbut can be switched to global regions. - Product & Brand: These fields start empty, allowing for broad or narrow searches.
2. Populate Product Specifics
To narrow down your dataset, select specific product codes and brand names. This is crucial for isolating data related to a particular SKU or product family.
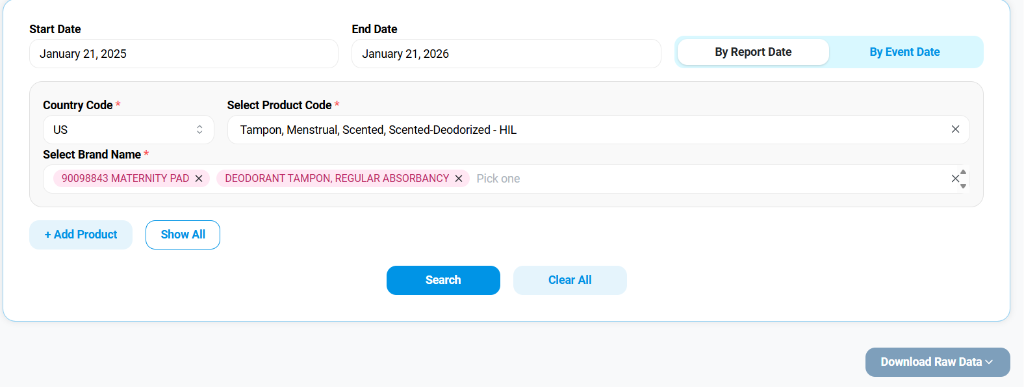
- Select Product Code: Use the dropdown to search for the FDA product code (e.g.,
HILfor certain menstrual products). - Select Brand Name: You can select multiple brands. As shown above, specific brands like
MATERNITY PADandDEODORANT TAMPONcan be tagged simultaneously. - Search: Click the blue Search button to execute the query against the database.
- Download Raw Data: Once your filters are set, use this dropdown to export the matching records for offline analysis in Excel or CSV format.
3. Analyze the Resulting Trends
After executing the search, the dashboard visualizes the data matching your specific criteria.
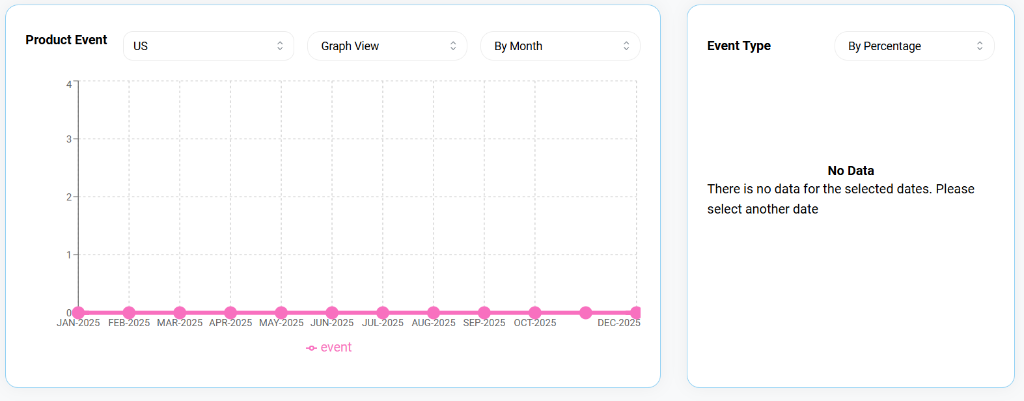
- Product Event Graph: Displays the frequency of events over your selected timeline (e.g., Jan 2025 - Dec 2025).
- Controls: Switch between
Graph ViewandTable View, or change the granularity toBy Month/By Week.
- Controls: Switch between
- Event Type: A breakdown of the events by percentage (e.g., Malfunction vs. Injury).
- Note: If no data exists for your specific combination of filters, a "No Data" message will appear as shown above.