IntelliRisk IQ
The IntelliRisk IQ module provides a centralized dashboard to monitor uploaded sessions, review outcomes, and quickly open reports for analysis, review, or export. It connects complaint data with hazard analyses to identify and reconcile post-market risks with pre-market design assumptions.
Dashboard Overview
The IntelliRisk IQ dashboard serves as the central control center for tracking and managing your risk reports.
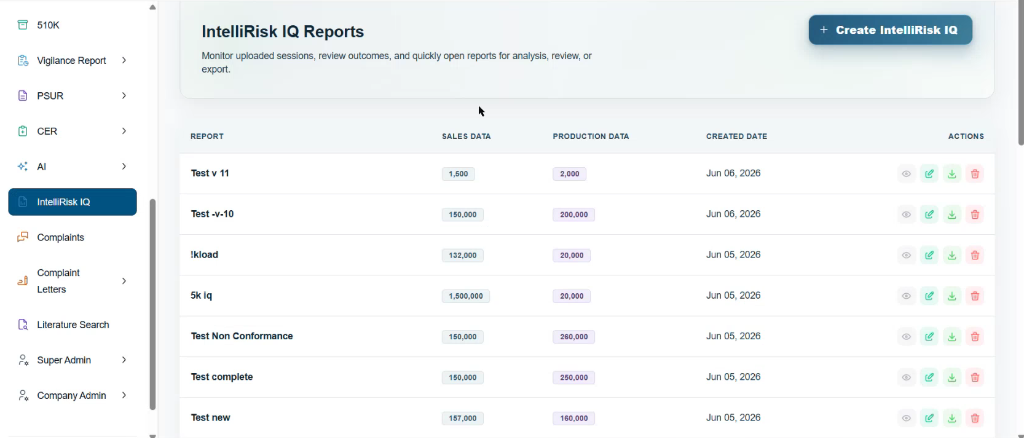
The main table lists all processed IntelliRisk IQ reports, providing a high-level view of key parameters:
- REPORT: The user-designated name of the uploaded session (e.g., Test v 11, Test -v-10, 5k iq).
- SALES DATA: Displays the sales volume or exposure numbers associated with that specific report, highlighted in a distinctive light-blue badge (e.g.,
1,500,150,000). This is used to normalize risk calculations against market exposure. - PRODUCTION DATA: Shows the production volume count used for the reporting period, highlighted in a light-purple badge (e.g.,
2,000,200,000). This helps compute accurate incident rates based on manufacturing metrics. - CREATED DATE: Indicates when the report was created and processed (e.g., Jun 06, 2026), serving as a clear audit trail.
- ACTIONS: A set of interactive controls to manage and review each report session:
- View (Eye Icon): Opens the detailed Analysis Dashboard to inspect category distributions, severity comparison charts, occurrence rates, and risk Rationales.
- Edit (Pencil Icon): Allows you to modify the report's metadata, such as updating the report name, sales numbers, or production volumes.
- Download (Arrow Down Icon): Exports the full report dataset, including categorization summaries, hazard mappings, and risk matrices.
- Delete (Trash Icon): Permanently removes the report and its corresponding calculations from the workspace.
Creating an IntelliRisk IQ Session
To start a new analysis, you must create a new session by uploading the appropriate datasets.

Create IntelliRisk IQ Button
The + Create IntelliRisk IQ button is located at the top-right corner of the dashboard.
Clicking this button opens a modal window that guides you through establishing a new assessment session:
- Define Report Identity: Set a clear and descriptive name for the session.
- Input Parameters: Enter the Sales Data and Production Data values to calibrate the normalization factors.
- Upload Datasets: Select and upload the required complaint data file and the corresponding hazard analysis/FMEA spreadsheets.
- Process: Click the processing button to initiate the automated mapping, probability calculations, and hazard evaluation engine.
Detailed Configuration and Upload Steps
Once you begin the creation process, the system guides you through a multi-step configuration wizard to set up and process your IntelliRisk IQ reports.
Step 1: Configure Report Metrics and Metadata
In this initial step, you define the core metadata and scope parameters for your analysis session.
-
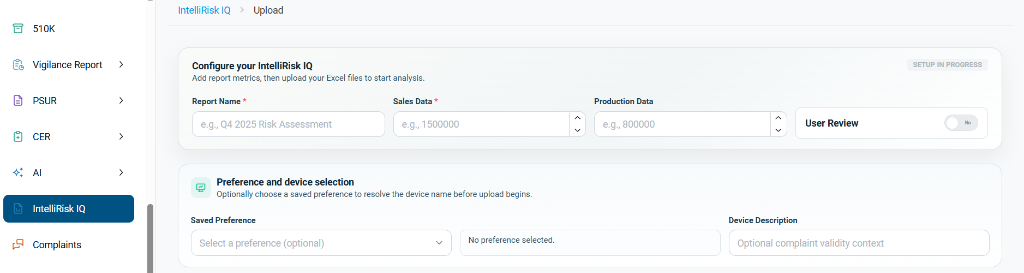
Configure your IntelliRisk IQ:
- Report Name (Required): Enter a clear and descriptive title (e.g.,
e.g., Q4 2025 Risk Assessment) to identify the analysis. - Sales Data (Required): Enter the total sales volume/exposure figures for the target period. This value is critical for normalizing complaint rates and calculating occurrence probabilities.
- Production Data: Enter the manufacturing/production volume. While optional, it is recommended to ensure complete risk normalization.
- User Review: A toggle switch (
Yes/No, defaults toNo). When enabled, this marks the session for a manual review workflow where changes and rationales must be verified. - Setup Status Badge: The badge at the top-right corner displays
SETUP IN PROGRESS, indicating that all required parameters are currently being configured.
- Report Name (Required): Enter a clear and descriptive title (e.g.,
-
Preference and Device Selection:
- Saved Preference (Optional): Choose a pre-configured system preference from the dropdown to automatically resolve and configure the device names/attributes before uploading files.
- Device Description: Write an optional text entry to provide additional context regarding complaint validity or device configuration.
Step 2: Select Upload Format and Add Files
In the second stage, you select your preferred workbook structure and upload the target data files.
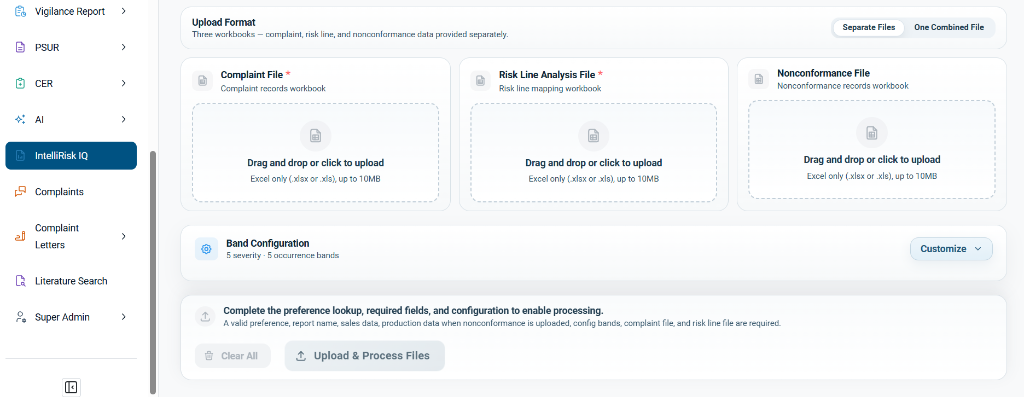
- Upload Format Options:
- Separate Files: The default mode, where you provide separate Excel workbooks for complaints, risk lines, and nonconformance data.
- One Combined File: Toggle this option if you are uploading a single workbook containing multiple sheets.
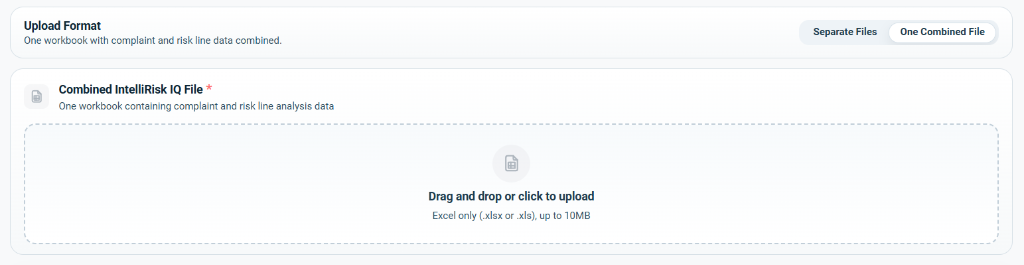
One Combined File Upload
If you select the One Combined File format, the upload panel adjusts to accept a single consolidated spreadsheet.
-
Combined IntelliRisk IQ File (Required): A single workbook containing both your complaint data and the risk line mapping tables in separate sheets. Supports
.xlsxor.xlsformat, up to 10MB. -
File Upload Zones (Separate Files Mode):
- Complaint File (Required): The workbook containing raw complaint records. Supports
.xlsxor.xlsformat, up to 10MB. - Risk Line Analysis File (Required): The mapping file linking complaint codes/categories to hazard IDs. Supports
.xlsxor.xlsformat, up to 10MB. - Nonconformance File (Optional): A workbook for nonconformance and manufacturing deviation data. If uploaded, Production Data becomes a required parameter.
- Complaint File (Required): The workbook containing raw complaint records. Supports
-
Band Configuration:
- By default, the system applies a standard grid configuration of 5 severity bands and 5 occurrence bands to map risks.
- Click Customize to expand and edit these bands to fit your organization's risk evaluation criteria.
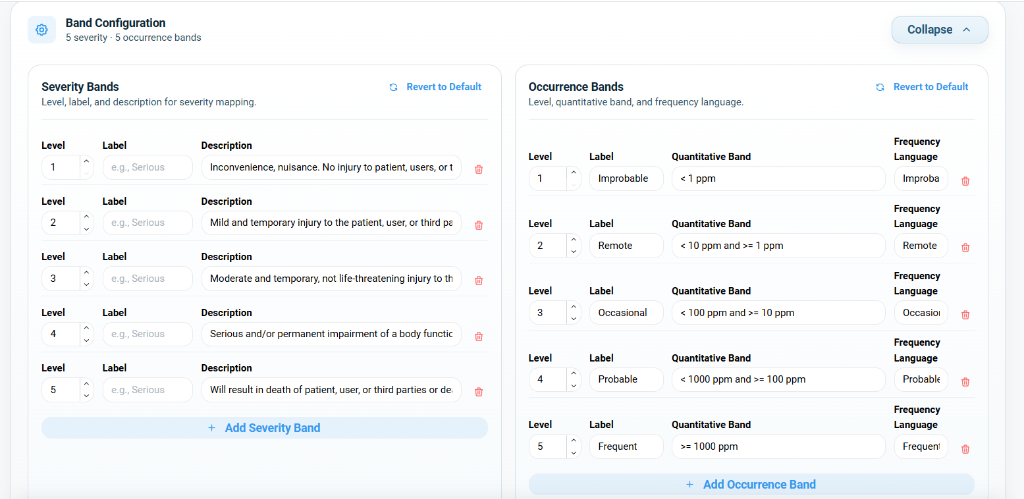
Customizing Risk Bands
When you click the Customize button (which toggles to Collapse when expanded), the Band Configuration panel opens, displaying two side-by-side grids for customizing your risk matrix parameters:
-
Severity Bands (Left Grid):
- Level & Label: Assign numeric levels (e.g., 1 to 5) and textual labels (e.g., Inconvenience, Mild, Moderate, Serious, Critical) to define each severity tier.
- Description: Define the clinical or operational impact for each severity level (e.g., Level 1: Inconvenience, nuisance. No injury... vs. Level 5: Will result in death of patient, user...).
- Management Controls:
- Click + Add Severity Band to add a new severity level to the matrix.
- Click the trash icon next to a level to delete it.
- Click Revert to Default to restore the default 5-tier severity configuration.
-
Occurrence Bands (Right Grid):
- Level & Label: Define numeric levels and corresponding occurrence labels (e.g., Improbable, Remote, Occasional, Probable, Frequent).
- Quantitative Band: Set the mathematical limits/ratios for each frequency level (e.g.,
< 1 ppm,< 10 ppm and >= 1 ppm,>= 1000 ppm). - Frequency Language: Enter descriptive terms matching internal quality system definitions (e.g., Improbable, Remote, Occasional, Probable, Frequent).
- Management Controls:
- Click + Add Occurrence Band to introduce an additional probability range.
- Click the trash icon next to a level to delete it.
- Click Revert to Default to restore the default 5-tier probability definitions.
- Validation Rules and Processing:
- A bottom informational panel summarizes the validation check: "Complete the preference lookup, required fields, and configuration to enable processing."
- To enable the action buttons, the following must be validly configured:
- A report name, sales data, and production data (if nonconformance data is uploaded).
- Configured risk matrix bands.
- A valid uploaded Complaint File and Risk Line File.
- Action Buttons:
- Clear All: Discards all entered configurations and uploaded workbooks.
- Upload & Process Files: Triggers the risk engine to parse, map, and calculate the report's metrics. This button remains disabled (greyed out) until all mandatory criteria are met.
Example Walkthrough: Setup and Validation Process
To demonstrate the system in action, here is an example of setting up, uploading, and validating a new IntelliRisk IQ session.
Step 1: Entering Metadata & Resolving Preferences
First, configure the report parameters and resolve your device preferences.
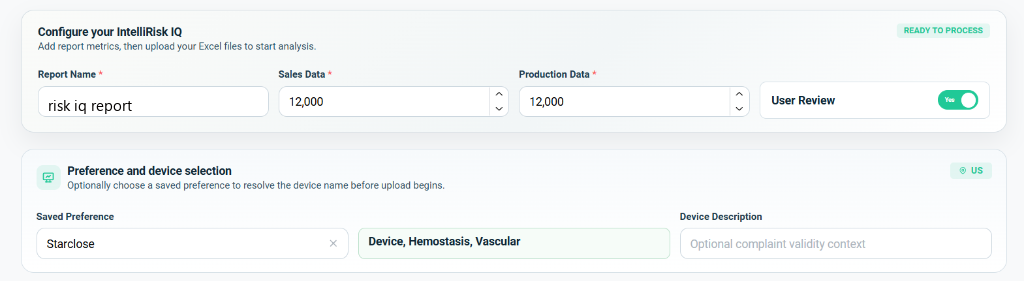
- Report Setup:
- Report Name: Set to
risk iq report. - Sales and Production Data: Both configured with
12,000to calibrate occurrence calculations. - User Review: Enabled (
Yes, in green), flagging this session for manual outcome inspection. - Status Badge: Updates to
READY TO PROCESSonce all metadata values are valid.
- Report Name: Set to
- Preference Resolution:
- Selecting the saved preference
Starcloseautomatically resolves the device toDevice, Hemostasis, Vascularand displays theUSregion badge.
- Selecting the saved preference
Step 2: Uploading Target Spreadsheets
Next, add your complaints, risk lines, and optional manufacturing files.
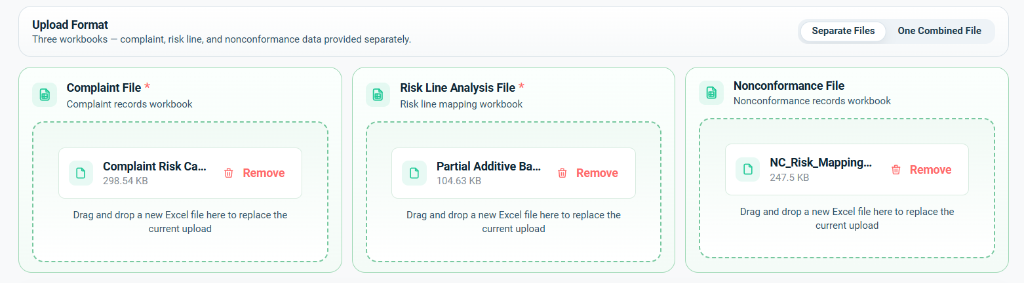
- Upload zones show the loaded workbooks:
- Complaint File:
Complaint Risk Ca...(298.54 KB) - Risk Line Analysis File:
Partial Additive Ba...(104.63 KB) - Nonconformance File:
NC_Risk_Mapping...(247.5 KB)
- Complaint File:
- Each block displays the file name, size, and a red Remove trash bin button to discard or replace files.
- Instructional placeholders update to "Drag and drop a new Excel file here to replace the current upload".
Step 3: Launching the Process
Once files are uploaded and validated, trigger the risk engine.

- A green checkmark banner confirms: Everything is set. You can start processing now.
- The Upload & Process Files action button is now fully enabled.
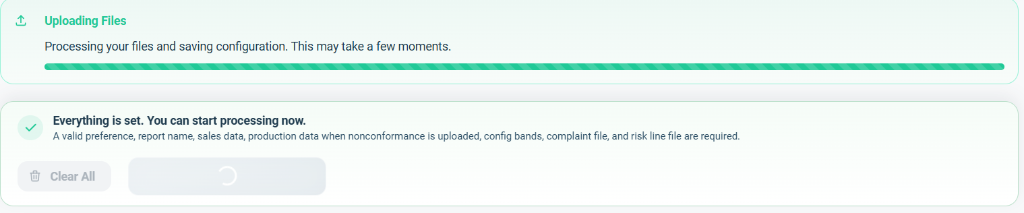
- Clicking Upload & Process Files starts the processing pipeline.
- An Uploading Files progress bar appears displaying the message: "Processing your files and saving configuration. This may take a few moments."
- The upload button changes to a loading spinner to prevent double submissions.
Step 4: Workflow Validation Engine
After upload, the system routes the files through the validation stage.
- The left-hand WORKFLOW navigation checklist monitors each stage of validation:
Complaint Validity(Active -PENDINGyellow status)Nonconformance Validity(Scheduled -PENDINGyellow status)Risk Line Mapping Review(Scheduled -PENDINGyellow status)Report(Final stage)
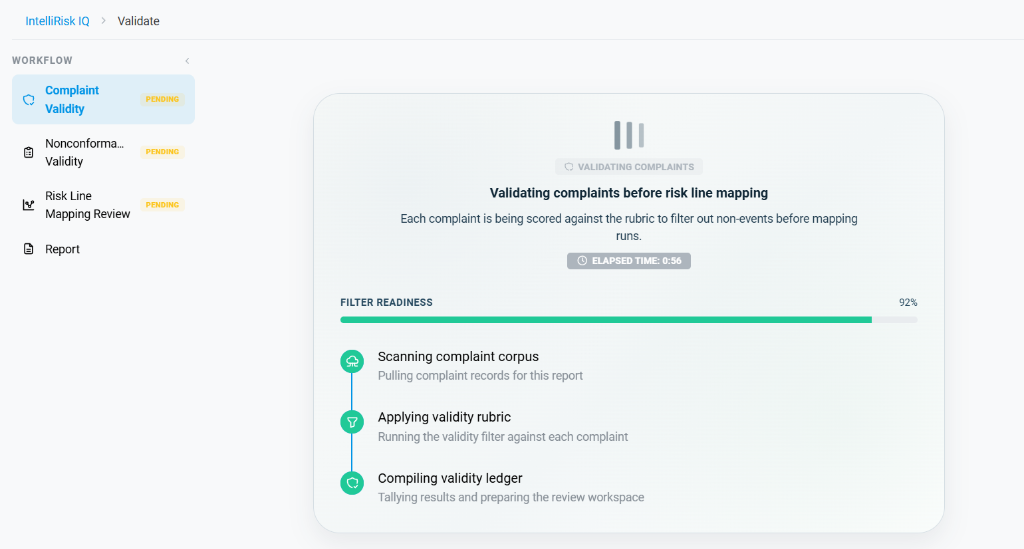
- The main validation card showcases the active scoring process:
- Validating complaints before risk line mapping: Informs the user that each complaint is being scored against rules to screen out non-events.
- Displays active counters like
ELAPSED TIME(e.g.,0:56) andFILTER READINESS(e.g.,92%). - Outlines the sub-tasks:
- Scanning complaint corpus: Pulls complaint records for this report.
- Applying validity rubric: Runs the validity filter against each complaint.
- Compiling validity ledger: Tallies results and prepares the review workspace.
Step 5: Complaint Validity Triage and Section Review
Once the validation engine completes its check, the workspace enters the Complaint Validity Triage phase. Here, you review the AI-determined classification of your complaints and override any incorrect decisions before proceeding.
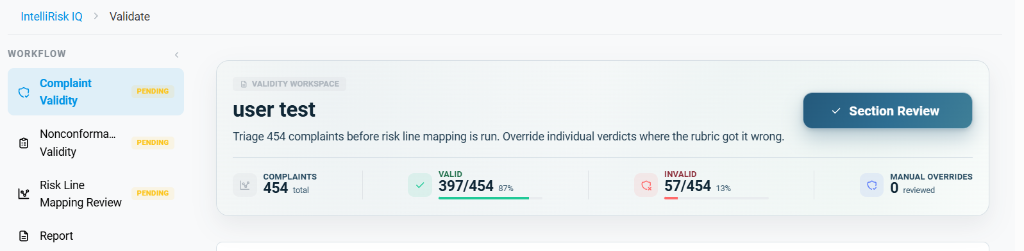
- Triage Overview:
- The workspace header indicates that the user must triage the complaints (in this example, 454 complaints) to verify their validity before the risk line mapping is executed.
- Dashboard Metrics:
- COMPLAINTS: Shows the total number of evaluated complaints (454 total).
- VALID: Indicates the count and percentage of complaints classified as valid adverse events (397/454, representing 87%).
- INVALID: Displays the count and percentage of filtered non-events (57/454, representing 13%).
- MANUAL OVERRIDES: Tracks the number of AI verdicts manually changed by the user (0 reviewed).
- The Section Review Button:
- Located at the top-right corner of the triage card is the blue ✓ Section Review button.
-
Mandatory Action
The Section Review button serves as a confirmation lock. You cannot proceed to subsequent workflow sections (e.g., Nonconformance Validity or Risk Line Mapping Review) until you click Section Review to accept the current validity triage.
Step 6: Accepting the Review and Moving Forward
Clicking the Section Review button confirms your changes and updates the workflow state.
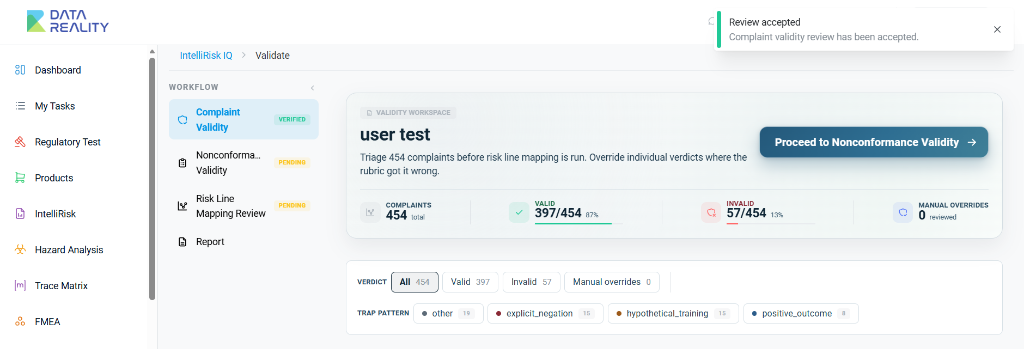
- Review Accepted Toast: A green success notification appears at the top-right corner saying: "Review accepted. Complaint validity review has been accepted."
- Workflow Status Update: The left-hand workflow panel updates the
Complaint Validitystatus badge fromPENDING(yellow) to a greenVERIFIEDstatus badge. - Proceed to Nonconformance Validity:
- Once the section review is confirmed, the button at the top-right transforms into: Proceed to Nonconformance Validity ->.
- Click this button to transition the workspace to the next phase, which is Nonconformance Validity (to review and validate manufacturing nonconformity records).
Step 7: Granular Triage Table & Manual Overrides
Below the dashboard card, the workspace renders a detailed grid listing every complaint, its AI-predicted verdict, source info, and classification rationale.
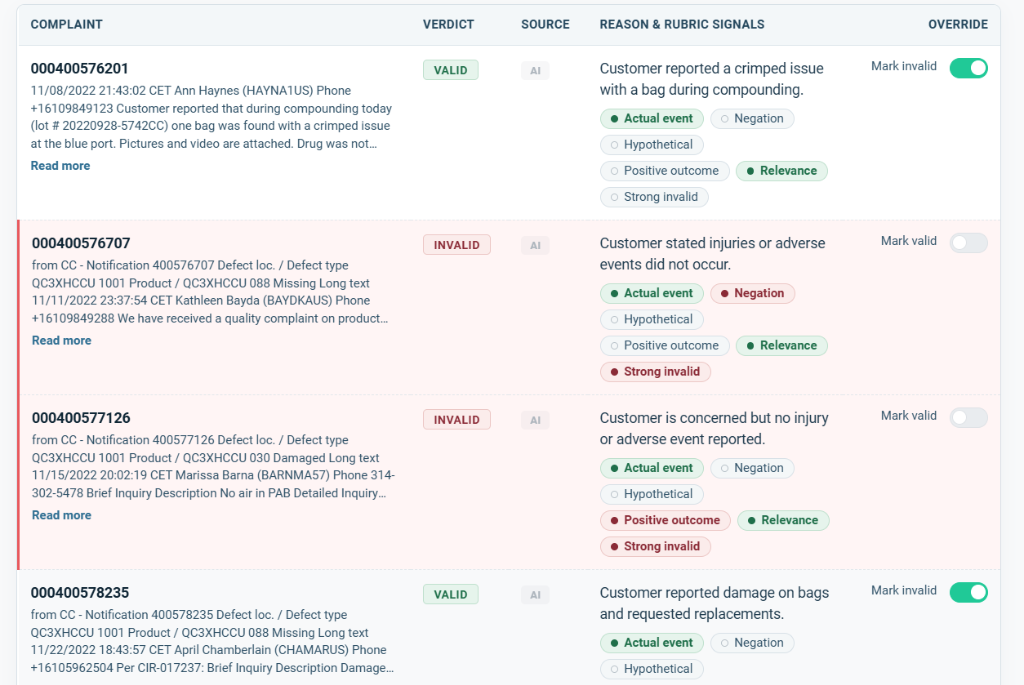
- Triage Table Columns:
- COMPLAINT: Displays the unique complaint ID (e.g.,
000400576201), date, reporter metadata, and a preview of the raw text. Click Read more to view the full complaint record. - VERDICT: Indicates the current status badge:
VALID(green badge) orINVALID(red badge). - SOURCE: Shows the decision origin (e.g.,
AIindicating it was classified by the automated evaluation engine). - REASON & RUBRIC SIGNALS: Displays the summary explanation along with the specific rubric checklist triggers:
- Actual event: Toggled if real adverse events are identified.
- Negation: Red or green indicators highlighting whether negation language (e.g., "no injuries occurred") was detected.
- Relevance: Evaluates the safety and performance relevance of the event.
- Strong invalid: Highlights markers indicating explicit non-events.
- COMPLAINT: Displays the unique complaint ID (e.g.,
- Manual Overrides (Mark Valid / Mark Invalid Toggles):
- The rightmost column (OVERRIDE) contains interactive toggle switches to correct any misclassifications:
- Mark valid: For complaints classified as
INVALIDby the AI (e.g., complaint000400576707and000400577126), you can flip the Mark valid toggle switch to manually override the verdict toVALID. - Mark invalid: For complaints classified as
VALIDby the AI (e.g., complaint000400576201and000400578235), you can flip the Mark invalid toggle switch to manually override the verdict toINVALID.
- Mark valid: For complaints classified as
- Any toggle action increments the MANUAL OVERRIDES counter on the main metrics dashboard.
- The rightmost column (OVERRIDE) contains interactive toggle switches to correct any misclassifications:
Saving Overrides
As soon as you toggle a decision, the system automatically saves the update in the background and flashes a toast notification.
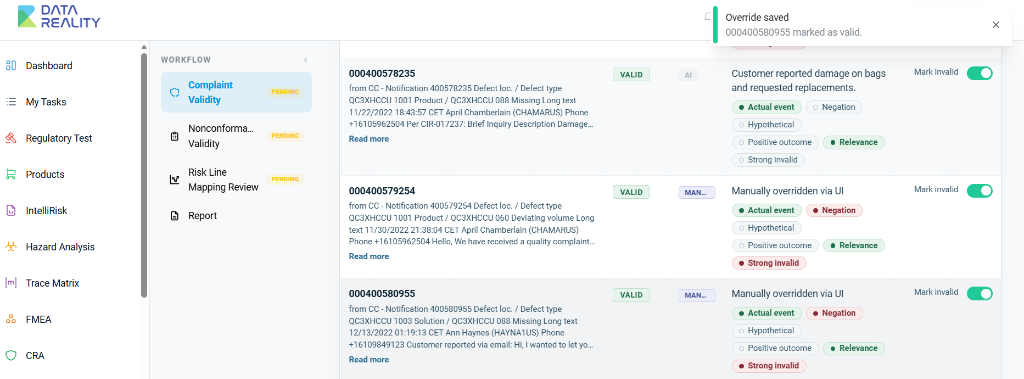
- Override Saved Toast: A confirmation notification pops up at the top-right corner of the interface (e.g., "Override saved. 000400580955 marked as valid.").
- Source Badge & Verdict Update:
- The SOURCE badge for the overridden row changes from
AIto a blue/purpleMAN..(Manual) badge, indicating it was modified by a user. - The REASON & RUBRIC SIGNALS content is replaced with the statement: "Manually overridden via UI", while preserving the toggle state controls so you can revert the action if necessary.
- The SOURCE badge for the overridden row changes from
Step 8: Confirming Complaint Validity
After performing manual overrides, you complete the manual verification process by locking in the section review.
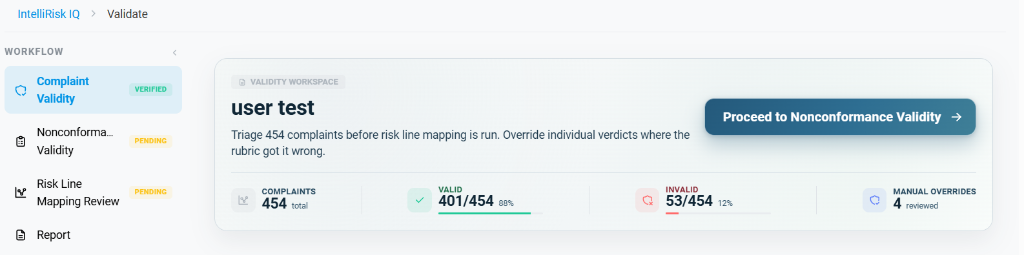
- Manual Verification:
-
Manual Triage Process
Clicking the Section Review button serves as a formal manual verification step, confirming that you have reviewed the automated classifications and approved the manual overrides.
- Once confirmed, the metrics card updates to show the finalized values (e.g., Valid
401/454at88%, Invalid53/454at12%, and4 reviewedmanual overrides). - The workflow menu on the left marks the Complaint Validity step as a green
VERIFIEDstate. - Click Proceed to Nonconformance Validity to continue.
-
Step 9: Nonconformance Data Processing & Validation
If you uploaded a manufacturing nonconformance file, the system routes you through the Nonconformance Validity validation pipeline.
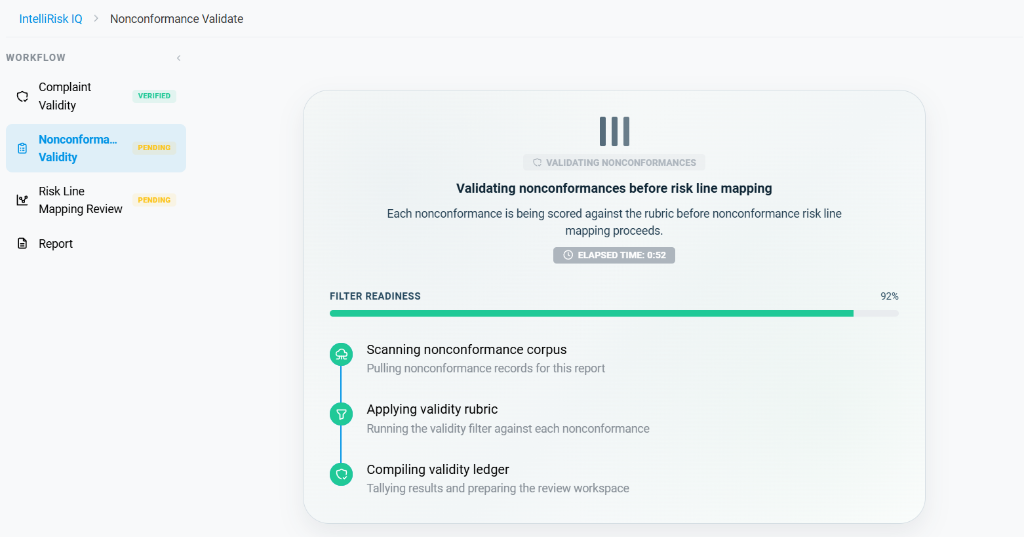
- Validating Nonconformances:
- The screen shows the loader stating: Validating nonconformances before risk line mapping.
- The system executes the scanning, validity rubric filter, and compilation checklist for the uploaded nonconformities.
- Displays progress statistics such as
ELAPSED TIME(e.g.,0:52) andFILTER READINESS(e.g.,92%).
Step 10: Nonconformance Validity Triage
Once processing completes, the nonconformance records are listed for verification.
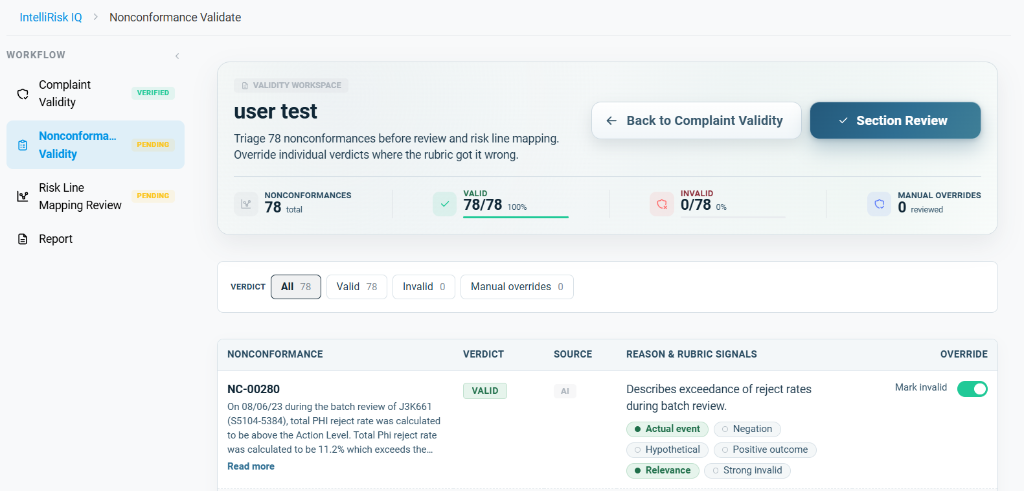
- Triage Parameters:
- NONCONFORMANCES: Shows the total count of uploaded manufacturing deviations (78 total).
- VALID: The count marked as valid nonconformities (78/78, representing 100%).
- INVALID: The count marked as invalid non-events (0/78, representing 0%).
- MANUAL OVERRIDES: Overridden records (0 reviewed).
- Granular Review Table:
- Shows the individual record IDs (e.g.,
NC-00280), descriptions of reject rates, and evaluation signals. - Similar to the complaint table, you can manually override entries using the Mark invalid toggle switch.
- Shows the individual record IDs (e.g.,
- Triage Confirmation:
- Click the blue ✓ Section Review button to sign off on the nonconformance triage list.
Step 11: Finalizing Nonconformance Review
Once validated, the nonconformance data is locked.
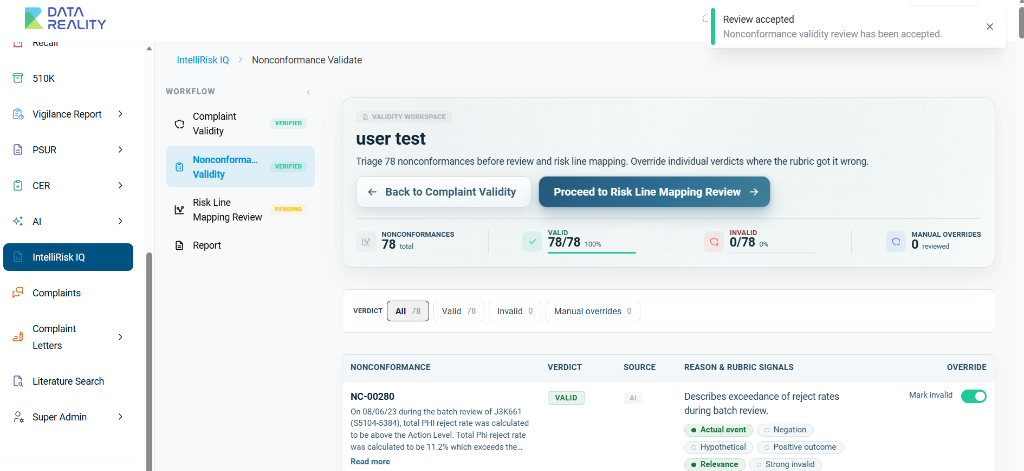
- Verification Confirmation:
- A toast notification displays: "Review accepted. Nonconformance validity review has been accepted."
- On the left sidebar, Nonconformance Validity is now marked with a green
VERIFIEDstatus badge alongsideComplaint Validity.
- Proceeding to Risk Line Mapping:
- With both complaint and nonconformance checks verified, click the Proceed to Risk Line Mapping Review -> button to advance to the next workflow stage.
Step 12: Loading the Mapping Review Workspace
After proceeding from the nonconformance stage, the system compiles the risk line mapping workspace.
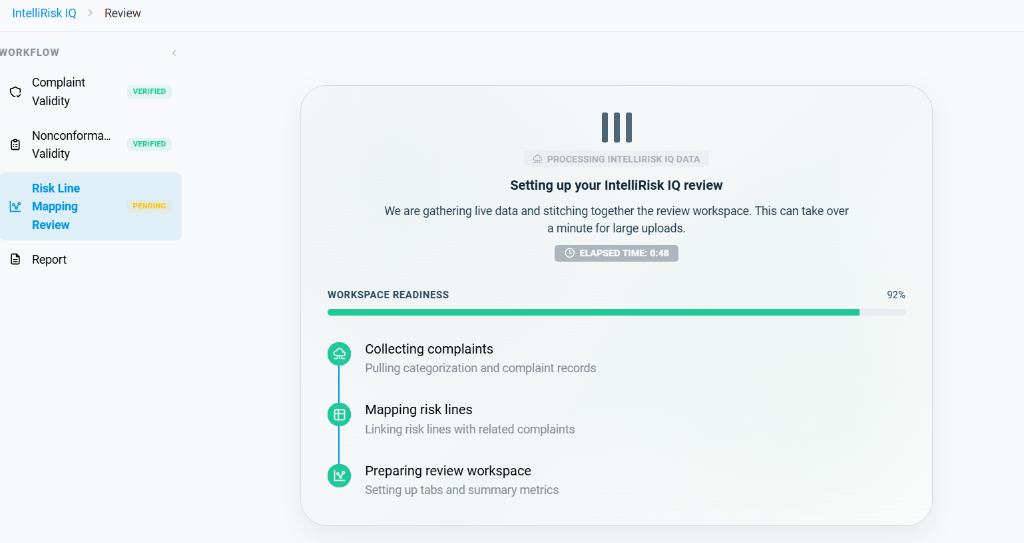
- Setup Progress:
- The interface shows the loading panel: Setting up your IntelliRisk IQ review.
- The system executes three main setup phases:
- Collecting complaints: Pulls all valid complaint records and their categories.
- Mapping risk lines: Links the resolved complaint and nonconformance data with corresponding hazard analysis risk lines.
- Preparing review workspace: Sets up tabs and calculates the summary statistics.
- Displays progress indicators such as
ELAPSED TIME(e.g.,0:48) andWORKSPACE READINESS(e.g.,92%).
Step 13: Risk Line Mapping Review Overview
Once prepared, the Risk Line Mapping Review workspace opens. This page serves as the final staging area where you audit the AI-suggested mappings between post-market incidents and design risk files.
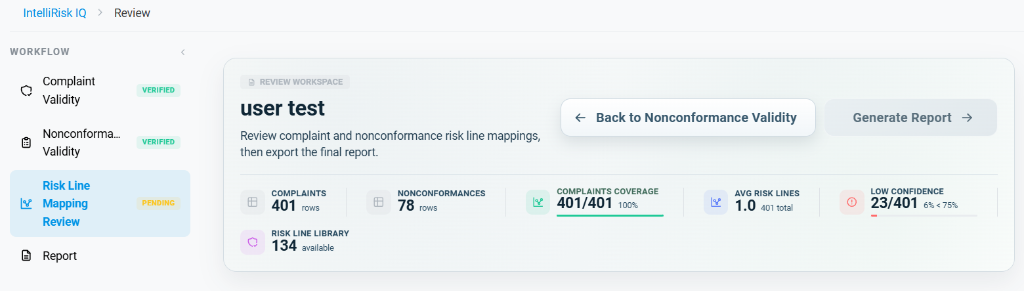
- Overview Stats Dashboard:
- COMPLAINTS: Total number of complaint records loaded for mapping (401 rows).
- NONCONFORMANCES: Total manufacturing deviation records (78 rows).
- COMPLAINTS COVERAGE: Shows the percentage of complaints mapped to at least one risk line (401/401, representing 100%).
- AVG RISK LINES: The average number of mapped risk lines per record (1.0).
- LOW CONFIDENCE: The number of mapping linkages that fall below the 75% confidence threshold (23/401, representing 6%).
- RISK LINE LIBRARY: The total number of available hazards inside the active FMEA/hazard analysis matrix (134 available).
- Action Restriction:
- The Generate Report -> button at the top-right remains greyed out (disabled). This restriction is in place because you must review and accept the mappings (both complaint and nonconformance mappings) before generating the final regulatory record.
Step 14: Complaint-Risk Line Mapping & Confidence Filtering
To review the mappings, you can toggle between viewing all complaints or filtering specifically for low-confidence mappings.
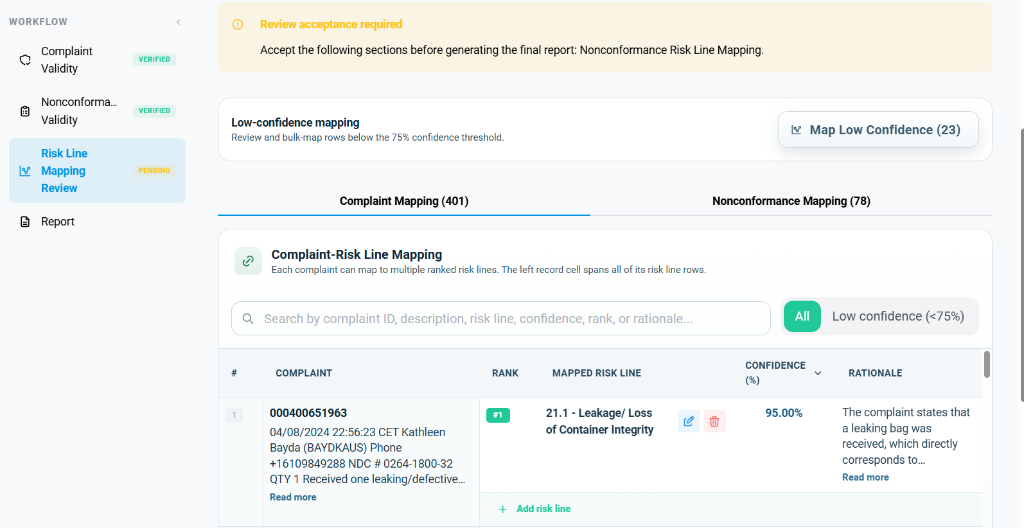
- Triage Tools:
- Search: A filter box to quickly find records by complaint ID, description, risk line, confidence level, rank, or rationale.
- Filtering Toggles:
- All Button: Active by default (in green). Shows all complaint records and their mapped hazard risk lines.
- Low confidence (<75%) Button: Filters the view to show only records that require closer verification due to low AI confidence.
- All Mappings View:
- Lists the row numbers, complaint descriptions, resolved mapping rank (e.g.,
#1), the mapped hazard statement (e.g.,21.1 - Leakage/ Loss of Container Integrity), the confidence level (e.g.,95.00%), and the AI-generated rationale explaining the link. - Provides manual overrides like edit (pencil icon) and delete (trash bin icon), as well as a + Add risk line option to map the complaint to additional hazards.
- Lists the row numbers, complaint descriptions, resolved mapping rank (e.g.,
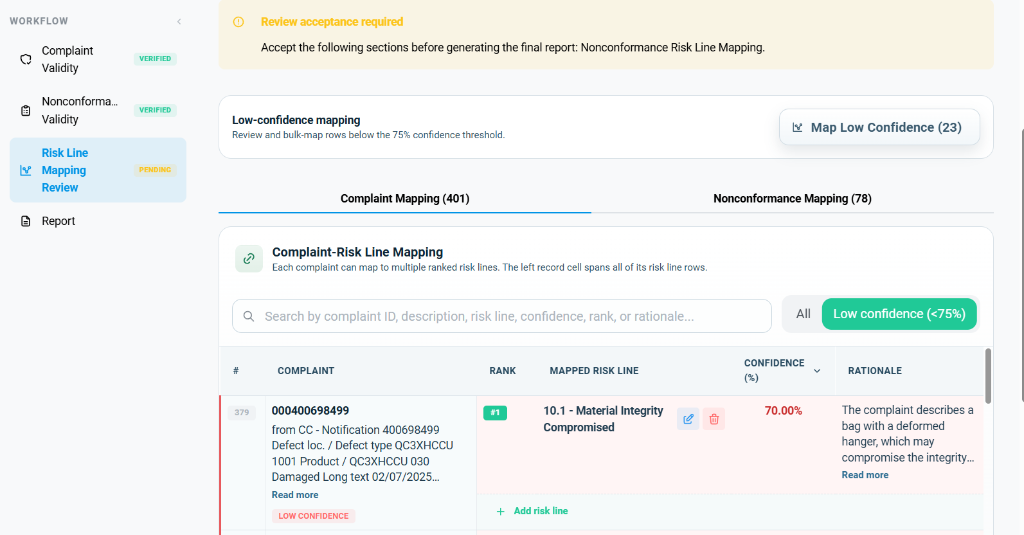
- Low-Confidence View:
- When the Low confidence (<75%) filter is selected, the list filters down to show the flagged mappings (e.g., 23 records).
- Low confidence rows display a red LOW CONFIDENCE badge next to the complaint ID and highlight the confidence percentage in red (e.g.,
70.00%). - Map Low Confidence (23): Clicking this button opens a bulk-triage tool to quickly review and edit these flagged mappings in sequence.
Step 15: Nonconformance-Risk Line Mapping Review
Switch to the second tab to audit manufacturing nonconformity mappings.
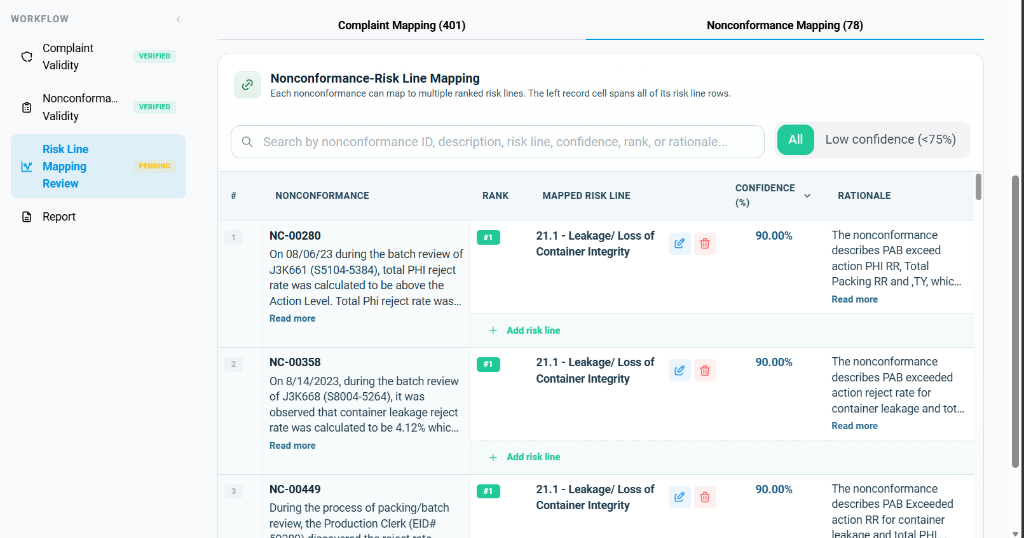
- Nonconformance Mapping Tab:
- Displays the active list of nonconformities (e.g., 78 rows).
- Lists individual records (e.g.,
NC-00280,NC-00358,NC-00449) along with descriptions, AI mapping rank (#1), mapped risk lines (e.g.,21.1 - Leakage/ Loss of Container Integrity), confidence levels (e.g.,90.00%), and rationales. - Includes manual controls to edit, remove, or add new risk line mappings for each nonconformance.
- Toggle buttons next to search bar allow filtering by All (Active in green) or Low confidence (<75%) (Inactive).
Step 16: Generating the IntelliRisk IQ Report
Once all preceding reviews are confirmed, the system initiates the final report compile.
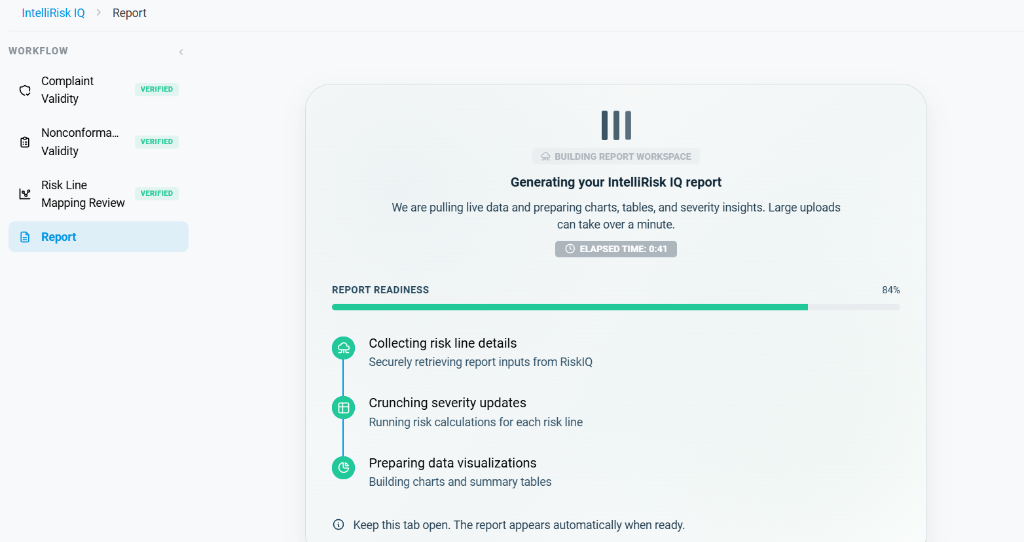
- Workflow Completion:
- On the left-hand side workflow menu, all three prior validation phases (Complaint Validity, Nonconformance Validity, and Risk Line Mapping Review) are marked as green and VERIFIED.
- The active step transitions to Report (highlighted in blue).
- Report Build Loader:
- The center panel displays the loading message: Generating your IntelliRisk IQ report.
- The engine processes the validated parameters in three consecutive sub-tasks:
- Collecting risk line details: Securely retrieves report inputs from the mapping database.
- Crunching severity updates: Executes risk probability calculations for each resolved risk line.
- Preparing data visualizations: Compiles summary tables and builds charts.
- Displays indicators like
ELAPSED TIME(e.g.,0:41) andREPORT READINESS(e.g.,84%).
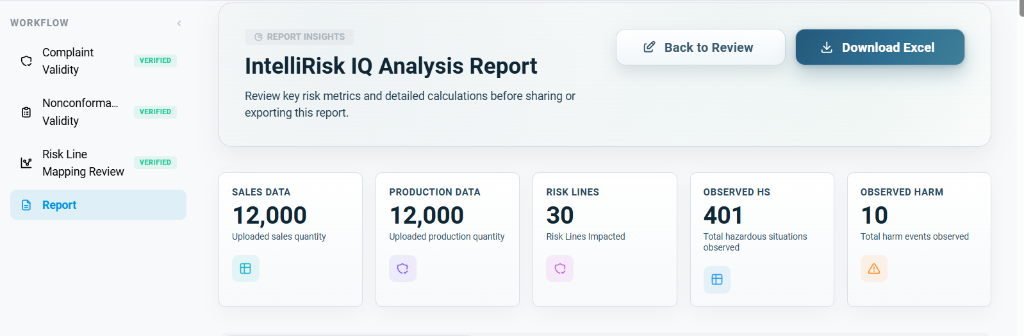
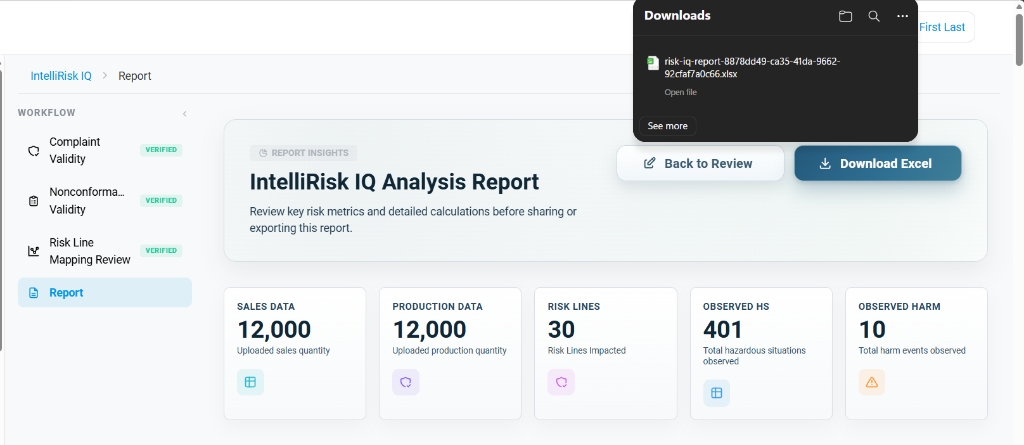
Step 17: IntelliRisk IQ Analysis Report Dashboard
Once processing completes, the interactive IntelliRisk IQ Analysis Report workspace is presented.
-
Report Header Actions:
- Back to Review: Allows going back to adjust any previous mapping decisions.
- Download Excel: Generates and downloads the finalized spreadsheet report for regulatory audit trails.
-
Report Insights Metrics:
- SALES DATA: Displays the total volume of sales quantity records uploaded (e.g.,
12,000Uploaded sales quantity). - PRODUCTION DATA: Displays the total volume of manufacturing production quantity records uploaded (e.g.,
12,000Uploaded production quantity). - RISK LINES: Shows the total number of impacted hazard risk lines (e.g.,
30Risk Lines Impacted). - OBSERVED HS: The total number of valid hazardous situations identified (e.g.,
401observed). - OBSERVED HARM: The total count of harm events observed from the logs (e.g.,
10observed).
- SALES DATA: Displays the total volume of sales quantity records uploaded (e.g.,
-
Risk Calculations Grid Metrics:
- To audit the risk values in detail, the calculations grid provides granular severity, probability, and risk priority metrics for each hazard.
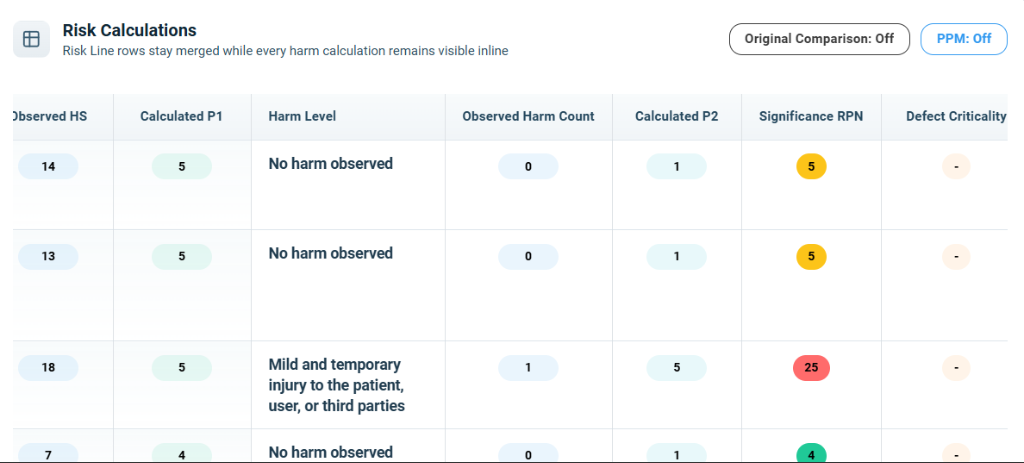
- Key Calculation Columns:
- Calculated P2: Represents the probability factor P2 computed by the engine based on clinical/field updates (e.g.,
1or5). - Significance RPN: The Risk Priority Number indicating the overall risk significance. It is calculated by multiplying occurrence and probability factors (
Calculated P1 * Calculated P2). RPN scores are color-coded based on significance:- Green (e.g., 4): Low risk/significance.
- Yellow/Orange (e.g., 5): Medium risk/significance requiring monitoring.
- Red (e.g., 25): High risk/significance requiring immediate attention or correction.
- Defect Criticality: Reflects the criticality classification of manufacturing or field defects mapped to the hazard (e.g., Critical, Major, Minor). A dash (
-) indicates that no specific defect criticality has been defined or mapped for the complaint/field events.
- Calculated P2: Represents the probability factor P2 computed by the engine based on clinical/field updates (e.g.,
Step 18: Auditing Calculated Risks (Tabbed Report Views)
Below the dashboard, the calculated results are organized into three dedicated tabs: Complaints, Nonconformance, and Combined.
Tab 1: Complaints Risk Calculations
Review quantitative calculations derived solely from patient/field complaint events.
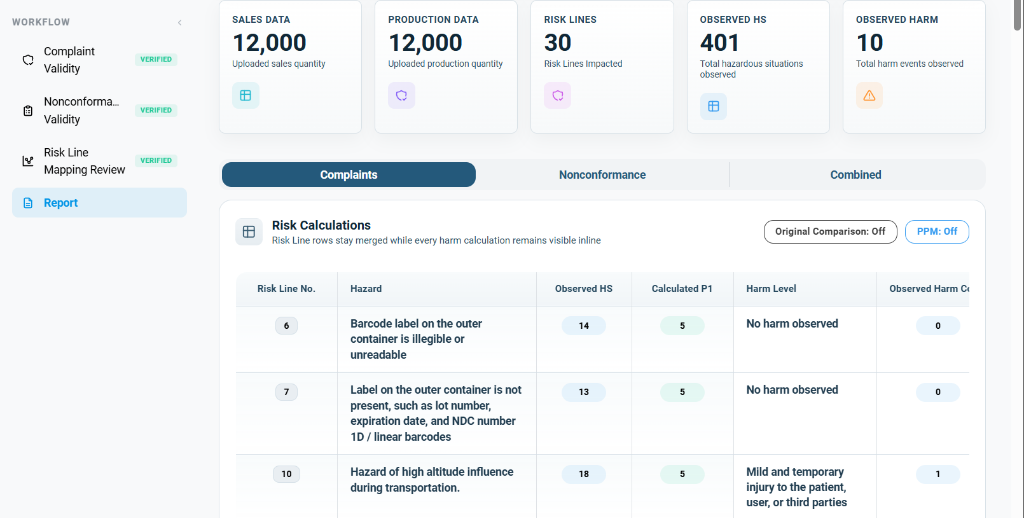
- Grid Header Controls:
- Original Comparison Toggle: When set to
Off, the table displays only the updated field values. - PPM (Parts Per Million) Toggle: When set to
Off, the probability values are displayed as raw score numbers (e.g., 1 to 5 index).
- Original Comparison Toggle: When set to
- Calculations Grid:
- Risk Line No. & Hazard: Lists the specific hazard ID (e.g.,
6,7,10) and description. - Observed HS: Shows the count of hazardous situations linked to that hazard (e.g.,
14for Line 6,13for Line 7,18for Line 10). - Calculated P1: The updated probability factor P1 computed by the engine (e.g., P1 of
5for all three lines). - Harm Level & Observed Harm Count: Displays the observed severity tier and absolute harm count (e.g., No harm observed with
0harm events for Line 6; Mild and temporary injury... with1harm event for Line 10).
- Risk Line No. & Hazard: Lists the specific hazard ID (e.g.,
Tab 2: Nonconformance Risk Calculations & Severity Updates
Review calculations derived from manufacturing deviations alongside severity shifts.
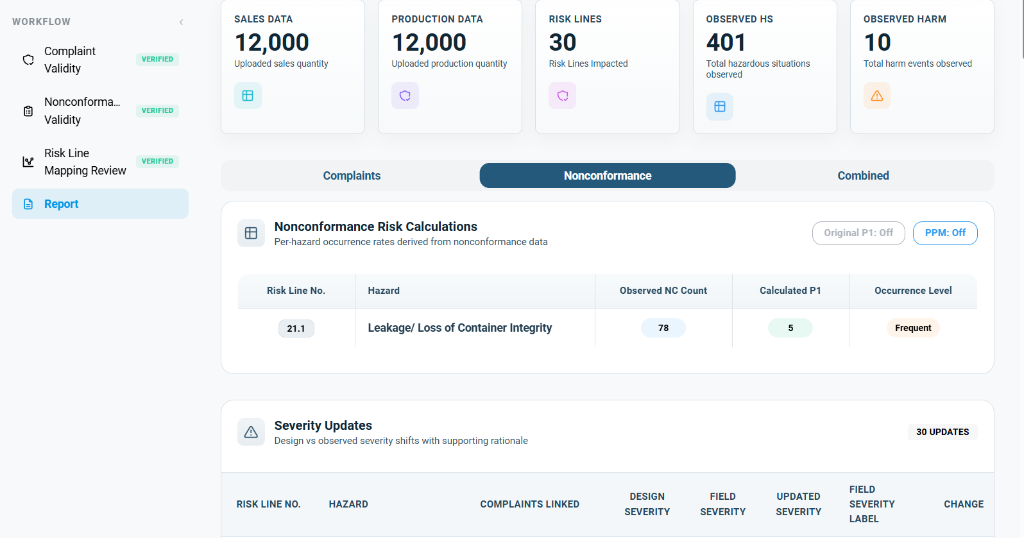
- Nonconformance Risk Calculations:
- Shows the occurrence rates derived from nonconformance data (e.g., Risk Line
21.1mapped to Leakage/ Loss of Container Integrity with an observed NC count of78, a calculated P1 of5, and an occurrence level of Frequent highlighted in an orange badge).
- Shows the occurrence rates derived from nonconformance data (e.g., Risk Line
- Severity Updates Panel:
- This section details design-level vs. observed-level severity deviations.
- Displays columns for Risk Line No., Hazard, Complaints Linked, Design Severity (e.g.,
S1), Field Severity (e.g.,S1), Updated Severity (highlighted in a green badge, e.g.,S1), Field Severity Label (e.g., Inconvenience...), and Change recommendations (e.g., No change).
Tab 3: Combined Risk Calculations & Original Comparison
This tab aggregates both complaint and nonconformance data, offering side-by-side benchmarking.
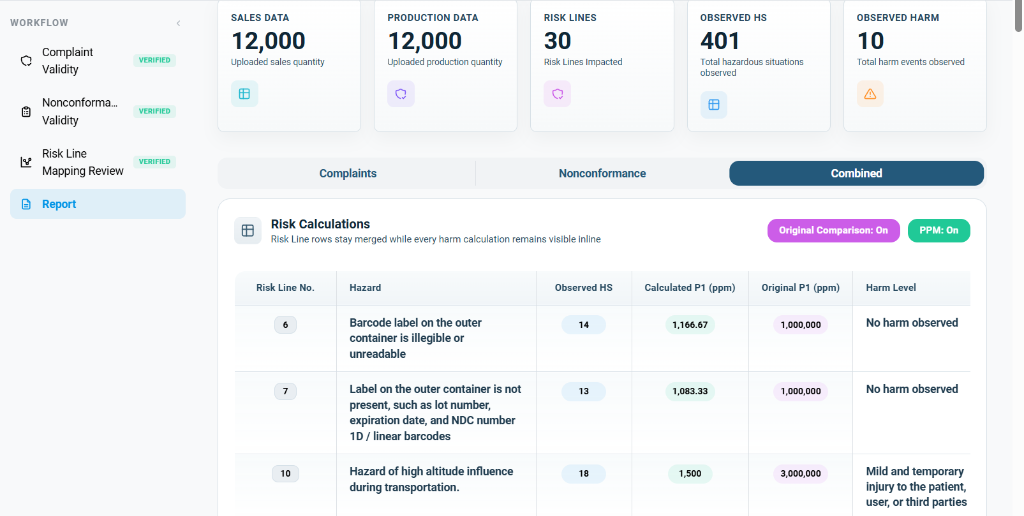
- Grid Header Controls Enabled:
- Original Comparison Toggle: Set to
On(highlighted in pink). This adds a comparative baseline column showing your pre-market design values. - PPM Toggle: Set to
On(highlighted in green). This converts the probability indices into normalized mathematical PPM values (Parts Per Million) for precise occurrence comparisons.
- Original Comparison Toggle: Set to
- Benchmarking Grid:
- Calculated P1 (ppm): The updated occurrence probability normalized to PPM (e.g.,
1,166.67 ppmfor Line 6,1,083.33 ppmfor Line 7,1,500 ppmfor Line 10). - Original P1 (ppm): Displays the baseline design-level occurrence probability (e.g.,
1,000,000 ppmfor Line 6,3,000,000 ppmfor Line 10). - Analysis Insight: This direct comparison highlights where observed post-market event rates are significantly lower or higher than design assumptions (e.g., for Line 10, the observed occurrence is
1,500 ppmcompared to the design estimation of3,000,000 ppm), providing necessary inputs for regulatory benefit-risk determinations.
- Calculated P1 (ppm): The updated occurrence probability normalized to PPM (e.g.,
Step 19: Exporting the Finalized Excel Report
To compile and export the audited risk data for local analysis or regulatory submissions, utilize the Download Excel action.
- Export Action:
- Clicking the Download Excel button in the top-right header initiates the server-side generation of the consolidated spreadsheet.
- The file is dynamically named using the format
risk-iq-report-[Unique UUID].xlsx(e.g.,risk-iq-report-8878dd49-ca35-41da-9662-92cfaf7a0c66.xlsx). - A native browser download notification or dialog will appear once the file package is prepared.
Step 20: Tracking Download Progress
For large workbooks containing extensive historical records, you can monitor the file delivery status directly through your browser's download manager.
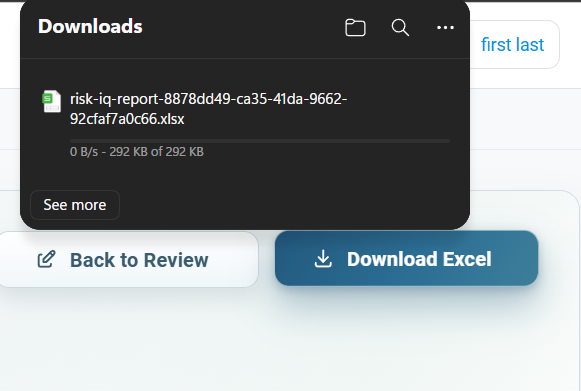
- Download Metrics:
- The browser's Downloads panel displays the download speed and total file transfer size (e.g.,
292 KB of 292 KB). - Once completed, actions such as Open file, Show in folder, or Delete become active, allowing quick access to the exported spreadsheet.
- The browser's Downloads panel displays the download speed and total file transfer size (e.g.,
Step 21: Analyzing the Exported Workbook Structure
Opening the generated Excel file reveals a structured multi-tab workbook that aligns with the validated workflow phases.
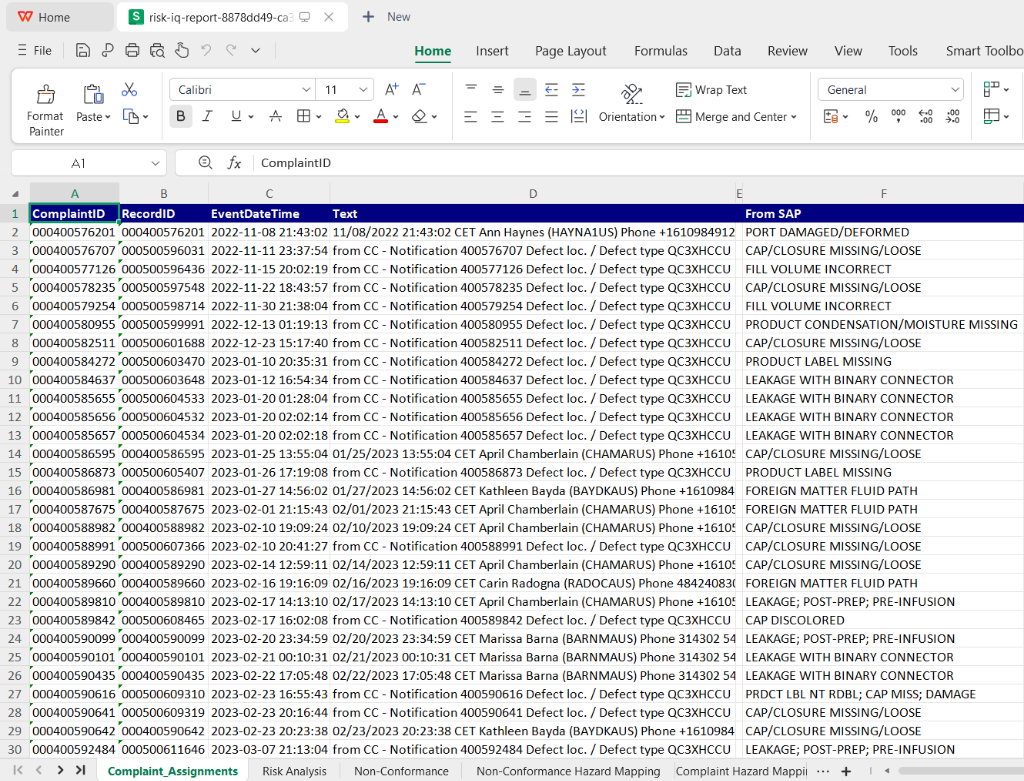
- Workbook Tabs (Sheets):
Complaint_Assignments: Contains the complete list of individual complaint records with their primary attributes and origin system tags.Risk Analysis: Houses the aggregated risk lines, calculated occurrence values (P1), PPM mappings, and baseline comparisons.Non-Conformance: Lists all manufacturer deviation records that were processed by the risk engine.Non-Conformance Hazard Mapping: Contains the mapped relationships between nonconformance reports and risk analysis hazard lines.Complaint Hazard Mapping: Details the mapping links between complaints and risk analysis hazards.
- Complaint Assignments Data Fields:
- ComplaintID (Column A): Unique system identifier for the customer complaint (e.g.,
000400576201). - RecordID (Column B): Internal tracking identifier for the event log (e.g.,
000500596031). - EventDateTime (Column C): The timestamp denoting when the event occurred (formatted as
YYYY-MM-DD HH:MM:SS). - Text (Column D): Free-text narrative containing CET timestamps, reporter details, and technical descriptions (e.g.,
from CC - Notification...). - From SAP (Column E): The standardized defect or failure mode text imported directly from the SAP ERP system (e.g.,
PORT DAMAGED/DEFORMED,CAP/CLOSURE MISSING/LOOSE,FILL VOLUME INCORRECT,PRODUCT CONDENSATION/MOISTURE MISSING,LEAKAGE WITH BINARY CONNECTOR).
- ComplaintID (Column A): Unique system identifier for the customer complaint (e.g.,