Literature Search
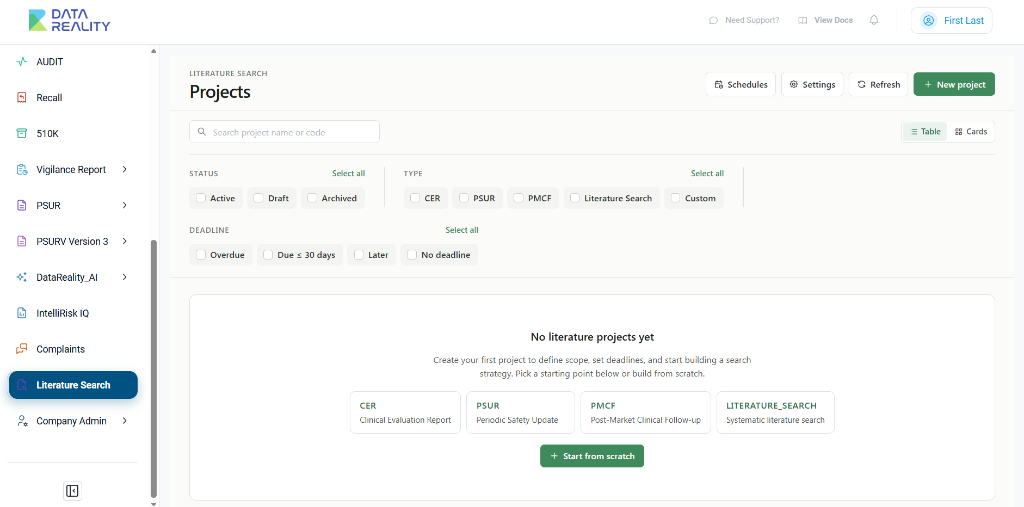
The Literature Search module allows you to manage literature search projects, define scopes, set deadlines, and build search strategies.
Projects Dashboard
The Projects dashboard provides an overview of all your literature search projects. You can view projects as a table or cards and filter them by:
- Status: Active, Draft, Archived
- Type: CER (Clinical Evaluation Report), PSUR (Periodic Safety Update), PMCF (Post-Market Clinical Follow-up), Literature Search, Custom
- Deadline: Overdue, Due ≤ 30 days, Later, No deadline
1. Creating a New Project
To begin, click the + New project button on the Projects Dashboard. This will open the Create project modal where you will define the foundational details of your literature review.
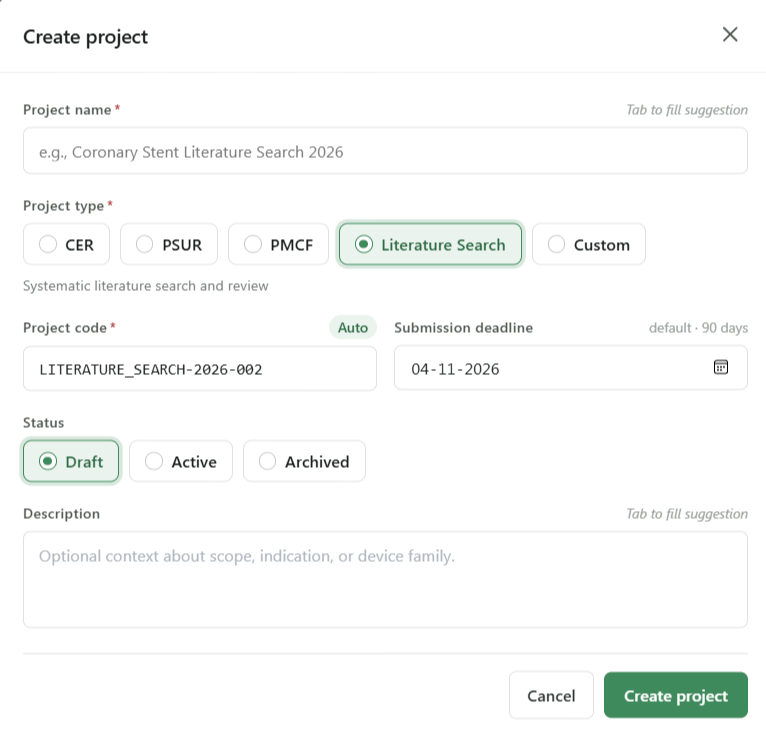
Here is a breakdown of the fields you need to fill out:
- **Project name ***: Enter a clear, descriptive title for your literature search.
- **Project type ***: Select the regulatory or clinical objective. Options include CER, PSUR, PMCF, Literature Search, or Custom. Select Literature Search for a systematic review.
- **Project code ***: A unique identifier that is automatically generated (Auto) for tracking, but you can manually override it if your organization uses a specific naming convention.
- Submission deadline: Set the target completion date for the review. It defaults to 90 days from the creation date.
- Status: The initial status is set to Draft. You can change this to Active when work officially begins, or Archived when completed.
- Description: An optional but highly recommended field to provide context, scope, or device family details for your team members.
Filling Out the Details
Provide the necessary information based on your clinical evaluation plan.
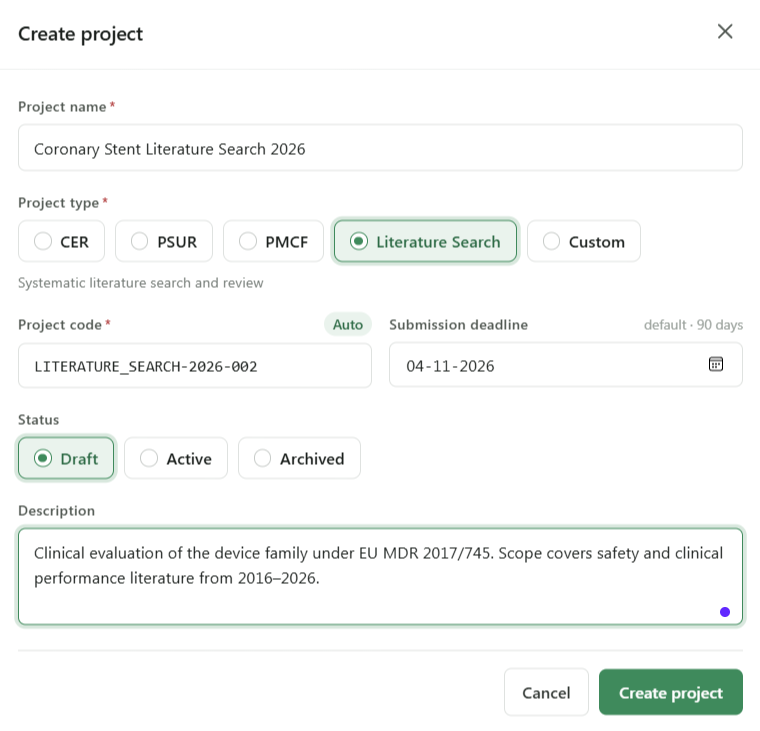
Once you have filled out all required fields (marked with a red asterisk *) and provided a detailed description, click the Create project button at the bottom right to proceed.
2. The Search Builder Workspace
After creating your project, you will be directed to the Search builder workspace. This is the central hub for constructing and executing your literature search strategy.
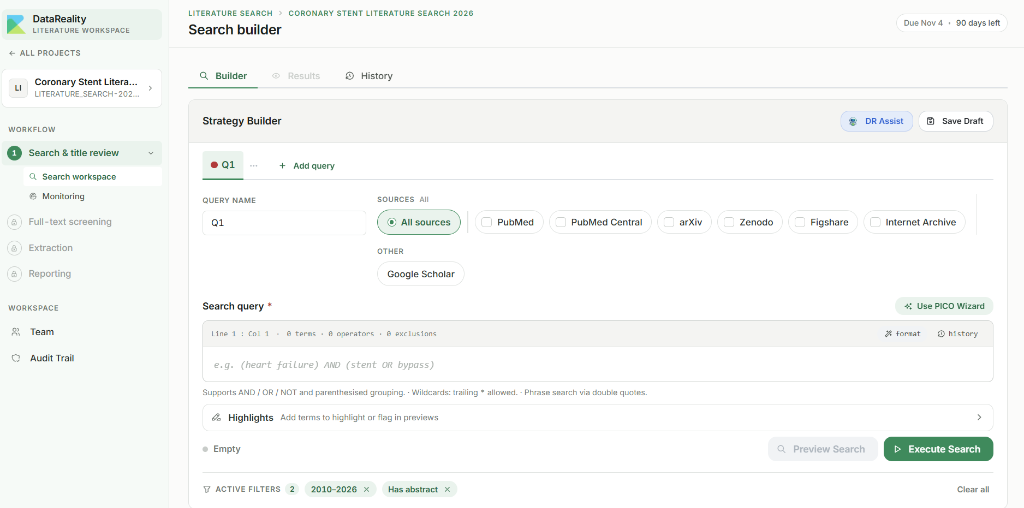
The interface is divided into several key areas:
- Left Sidebar (Workflow): Tracks your progression through the literature review lifecycle, including Search & title review, Full-text screening, Extraction, and Reporting.
- Top Bar: Displays the project name, current section, and the countdown to your submission deadline.
- Main Canvas: Houses the Strategy Builder, where you will define your search queries and select your data sources.
3. Utilizing AI and Saving Progress
In the top right corner of the Strategy Builder, you will find two very important tools to streamline your workflow:

- DR Assist: Click this button to leverage DataReality's AI assistant. DR Assist can help you formulate complex boolean queries, suggest medical synonyms (MeSH terms), and translate your clinical requirements into an optimized search strategy.
- Save Draft: Literature searches can be complex. Use this button frequently to save your work-in-progress without executing the search, ensuring you don't lose any intricate query logic.
4. Constructing Your Search Strategy
The core of the Literature Search module is the Strategy Builder, where you construct the actual queries that will be sent to medical databases.
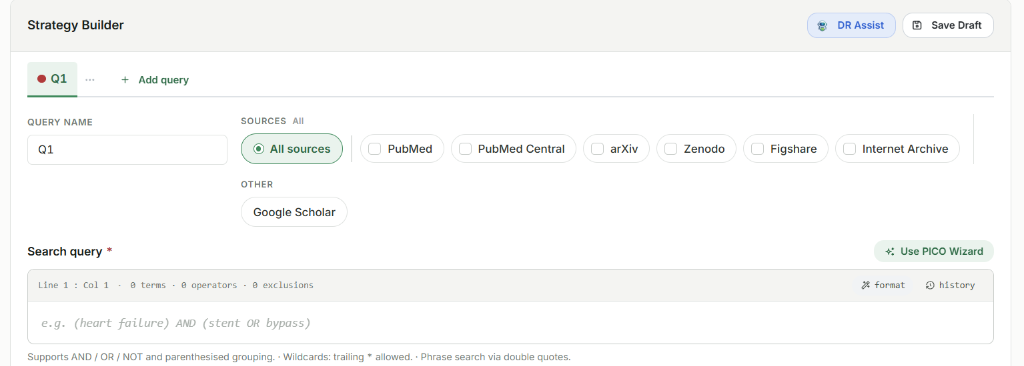
Here is how to use the Strategy Builder:
- Query Name: Assign a label to your query (e.g.,
Q1). This is useful when you are running multiple, separate queries that you plan to combine later. - Sources: Select the databases you want to query. You can choose All sources or select specific ones like PubMed, PubMed Central, arXiv, Google Scholar, and more.
- Use PICO Wizard: If you need a structured approach, click the Use PICO Wizard button. This will guide you to build your query based on Population, Intervention, Comparison, and Outcome criteria.
- Search query: This is the text area where your boolean logic goes. It fully supports
AND,OR,NOT, parenthesised grouping, and wildcards (e.g.,*). - Execute Search: Once your query is formulated and sources are selected, click the green Execute Search button to pull in the literature for review.
Here is an example of a populated search query for "heart failure" across multiple sources:
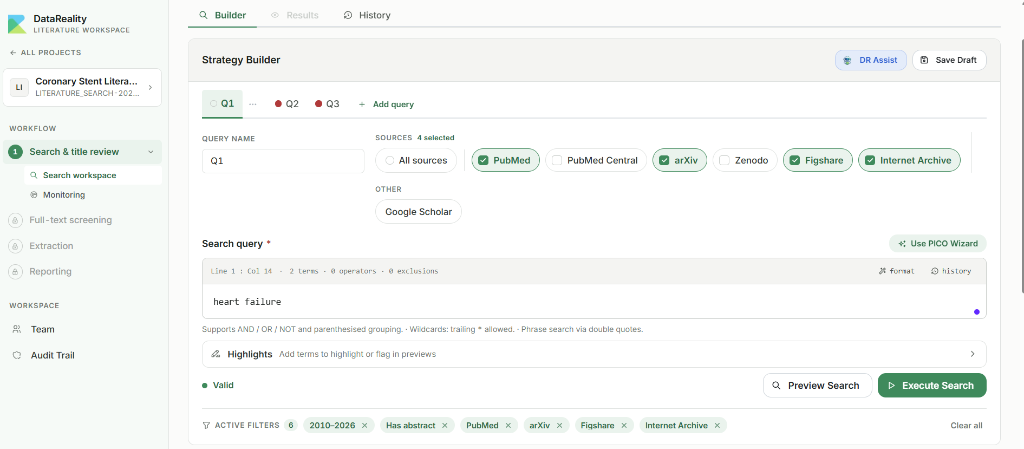
- Sources Selected: In this example, PubMed, arXiv, Figshare, and Internet Archive have been selected. The system will aggregate results from all these databases simultaneously.
- Search Query: A simple text query is entered, but complex boolean strings can also be typed manually.
- Preview Search vs Execute Search: You can click Preview Search to quickly estimate how many results your query will yield before permanently executing and saving the search to your project history.
Using the PICO Wizard
For systematic reviews, structuring your question is critical. The PICO Wizard provides a guided interface to ensure all clinical parameters are met.
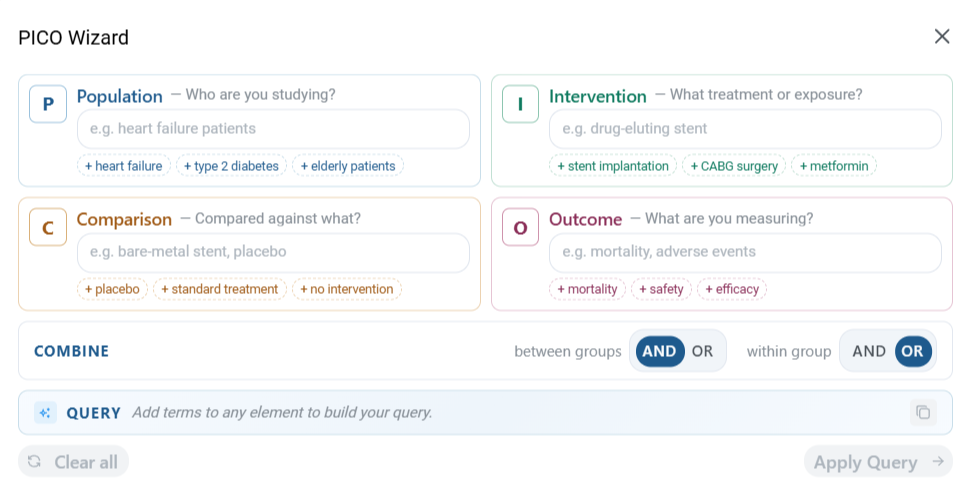
- P - Population: Define who you are studying (e.g., heart failure patients). You can add multiple synonyms (like type 2 diabetes or elderly patients) and they will be grouped logically.
- I - Intervention: Define the treatment or exposure (e.g., drug-eluting stent).
- C - Comparison: (Optional) Define what the intervention is compared against (e.g., bare-metal stent, placebo).
- O - Outcome: Define what you are measuring (e.g., mortality, adverse events).
- Combine: Choose how to link these groups. Typically, you will use
ANDbetween groups andORwithin groups. Clicking Apply Query will translate this structure into a complex boolean string in your search box.
Highlights and Flag Terms
To speed up your screening process, use the Highlights feature located just under the search query box.
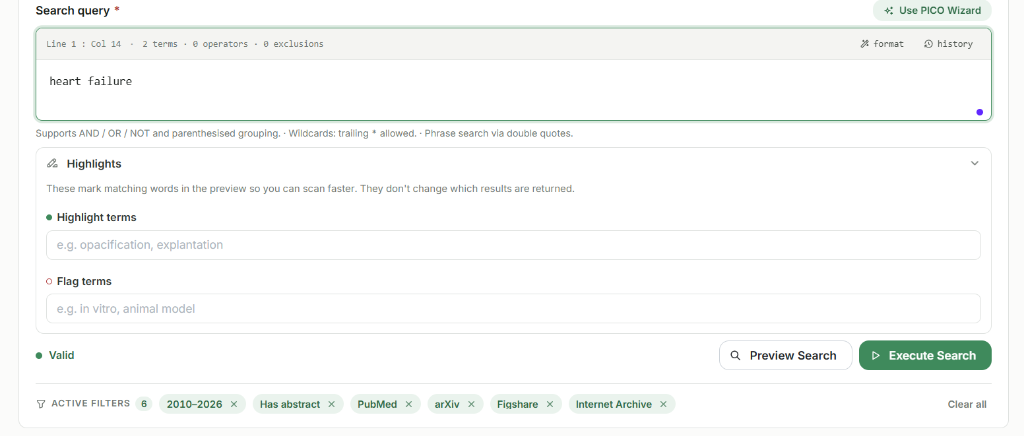
- Highlight terms: Words entered here will be highlighted in green within the abstracts and titles of your search results, allowing you to scan for relevance much faster.
- Flag terms: Words entered here (often exclusion criteria like "in vitro" or "animal model") will be flagged in red.
- Note: Adding terms here does not change which results are returned by the database; it only changes how they are visually presented to you during review.
5. Reviewing Results and Applying Filters
Once you execute or preview a search, the results will populate in the main canvas.
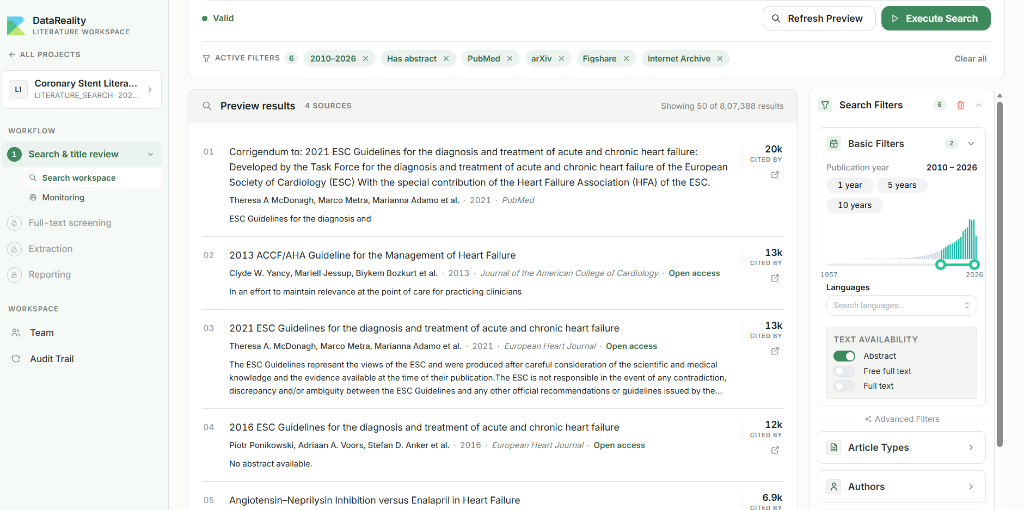
- Results List: Displays the retrieved articles with their title, authors, publication year, journal, and citation count. A link to the original open access text is provided if available.
- Search Filters (Right Sidebar): Allows you to narrow down thousands of results into a manageable subset.
Managing Search Filters
The filter panel is incredibly powerful for refining your literature search.
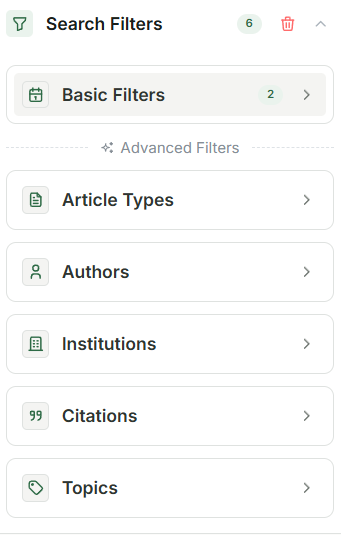
- Basic Filters: Quickly filter by publication year (e.g., last 1 year, 5 years, 10 years, or a custom range) and Text Availability (e.g., must have an Abstract, or Free full text). A bar chart visualizes the distribution of publications over time.
- Article Types: Filter for clinical trials, meta-analyses, or randomized controlled trials.
- Authors & Institutions: Narrow down to specific key opinion leaders or research centers.
- Citations & Topics: Filter by minimum citation count or specific medical subject headings (MeSH).
6. Execution, Screening, and Deduplication
Once your strategy is defined and refined using filters, you can move forward with execution and screening.

- Preview Search: Displays an estimated count and sample results without permanently saving the query.
- Execute Search: Runs the query and saves the retrieved records into your project database for screening.
Search Results Overview
After executing the search, the interface shifts to the Results tab.
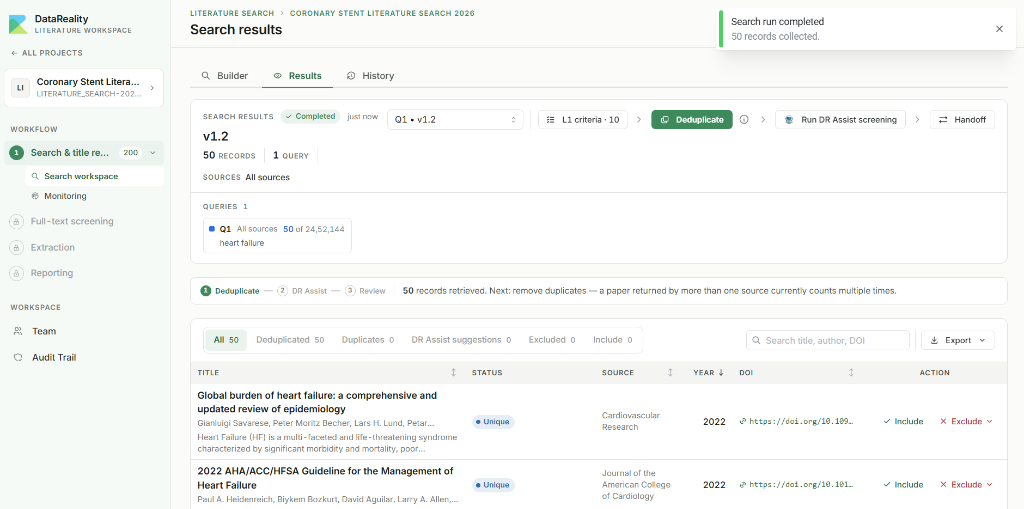
- Confirmation Banner: Displays a success message (e.g., "Search run completed") with the total records collected.
- Query Versioning: The top dropdown (e.g.,
Q1 • v1.2) allows you to navigate between different versions of your executed queries. - Record List: All retrieved papers are listed below, displaying their Title, Authors, Status, Source, Year, and DOI.
The Deduplication Phase
When multiple sources are queried, the same paper may appear multiple times.
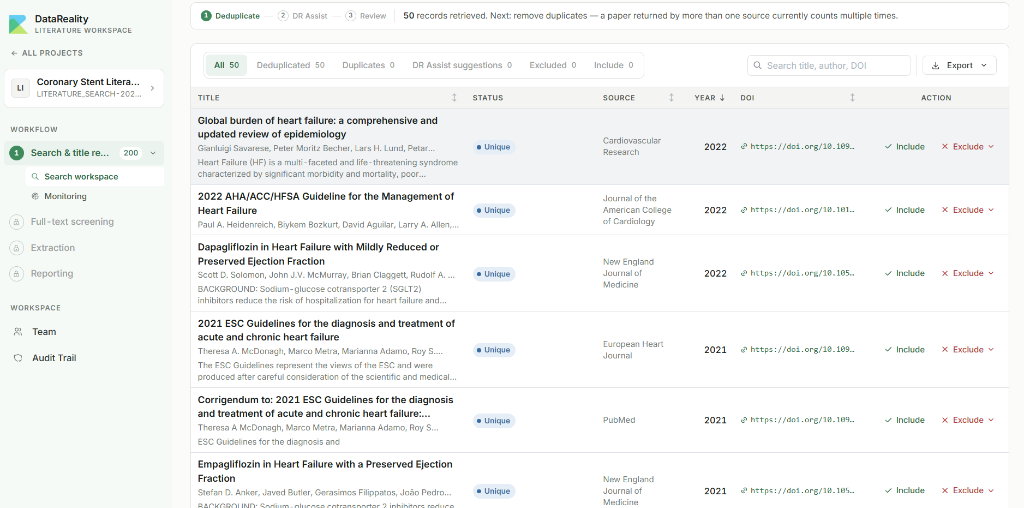
- Deduplicate Step: The status bar indicates the next required action: "Next: remove duplicates". This ensures a paper returned by multiple sources is only screened once.
- Action Buttons: Each record has an Include and Exclude button for manual screening.
Applying Exclusions
During manual screening, you must categorize why a paper is rejected to maintain a compliant audit trail.
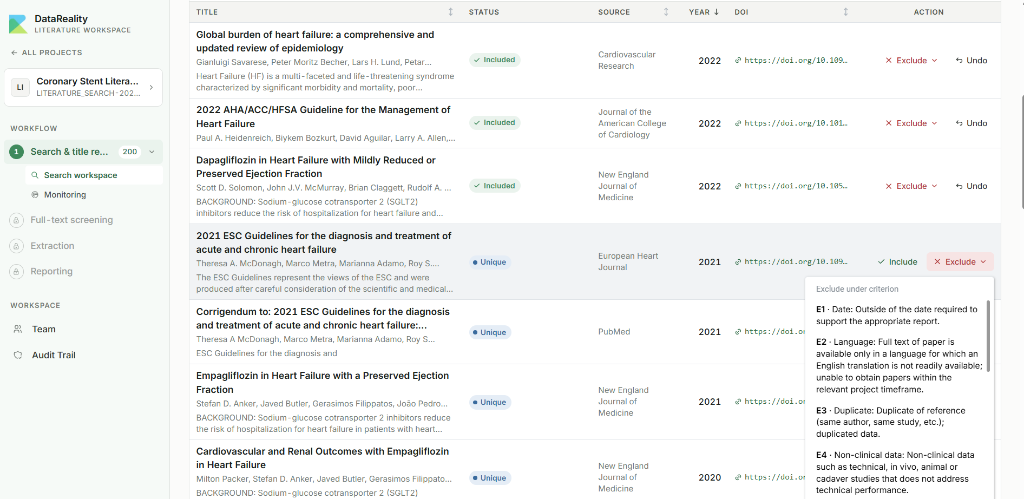
- Exclude under criterion: Clicking Exclude opens a dropdown of standardized reasons.
- E1 - Date: Outside the required timeframe.
- E2 - Language: Not available in the required language.
- E3 - Duplicate: Already processed.
- E4 - Non-clinical data: In vitro, animal, or cadaver studies.
Automated Screening and Handoff
For high-volume projects, manual screening can be augmented.

- Run DR Assist screening: Initiates the AI to pre-screen and suggest inclusions/exclusions based on your project description.
- Handoff: Once the title and abstract screening is complete, click this to advance the workflow to the next stage (Full-text screening).
7. AI Assistance and Phase Handoff
As you process your results, you can leverage advanced AI tools and finalize the phase.
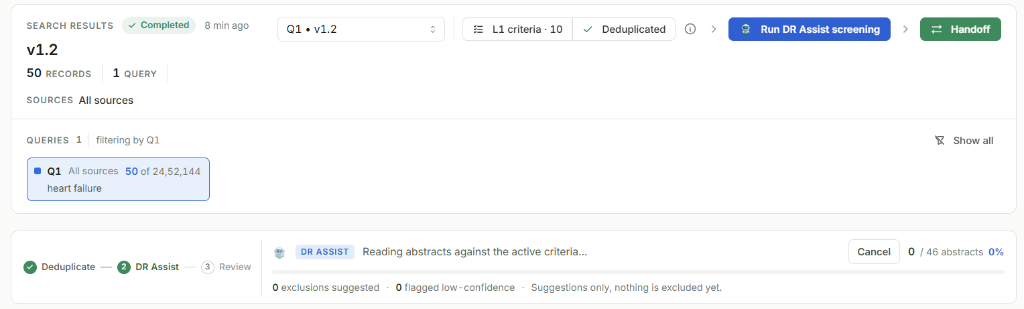
- DR Assist Screening: When initiated, the AI reads abstracts against your active criteria. A live progress bar indicates how many abstracts have been processed.
- AI Suggestions: It will suggest exclusions or flag low-confidence matches. Note: The AI only provides suggestions; nothing is permanently excluded without your confirmation.
Finalizing the Handoff
Once all records are reviewed (or if you want to bulk-process the rest), initiate the Handoff.
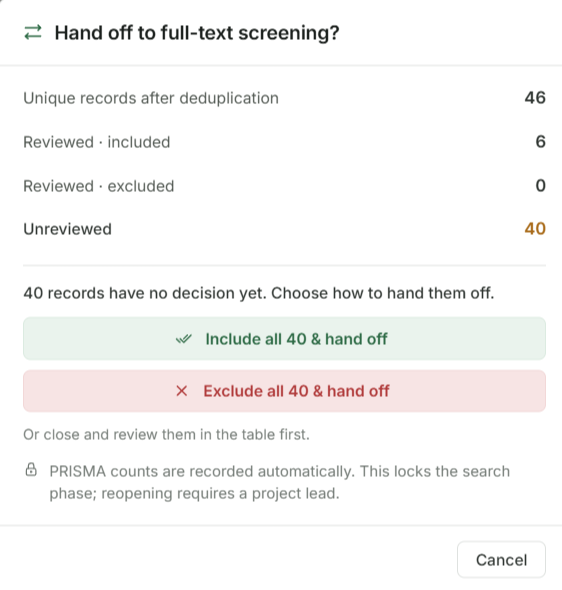
- Handoff Modal: Displays a summary of deduplicated records, showing how many are Included, Excluded, and Unreviewed.
- Bulk Actions: You can choose to Include all or Exclude all unreviewed records to quickly advance to full-text screening.
- Locking Phase: Completing the handoff automatically locks the search phase and records PRISMA counts.
8. Modifying a Locked Search
If you discover a flaw in your strategy after handoff, you can reopen the builder.
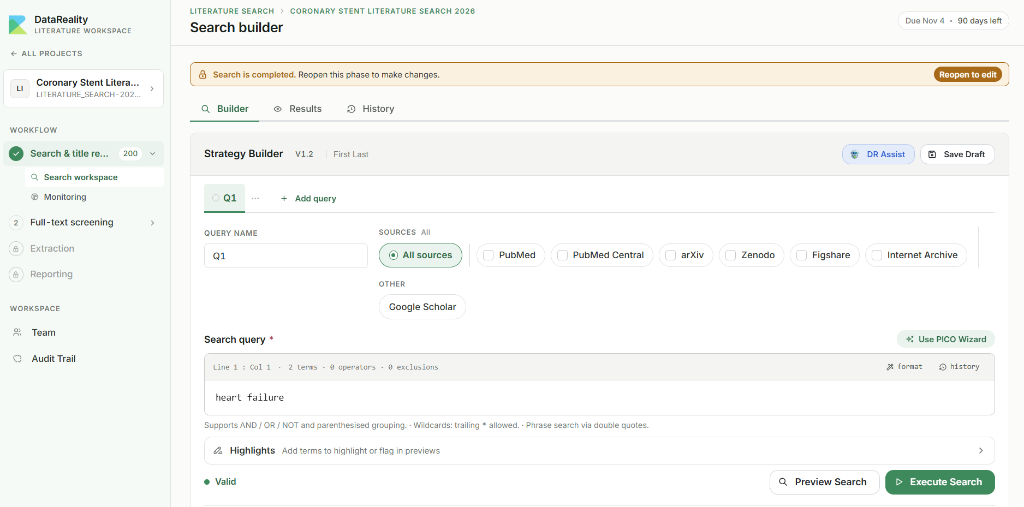
- Locked State: A banner warns that the search is completed.
- Reopen to Edit: Click this button to unlock the query builder and adjust your parameters.
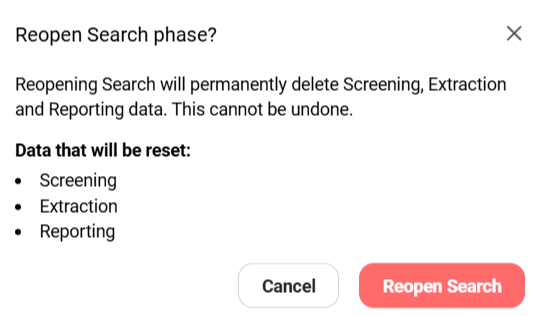
- Reopen Warning: Reopening a search phase will permanently delete downstream data (Screening, Extraction, Reporting) to maintain scientific integrity. Proceed with caution.
Refreshing the Preview
Once reopened, you can modify your boolean query and filters.
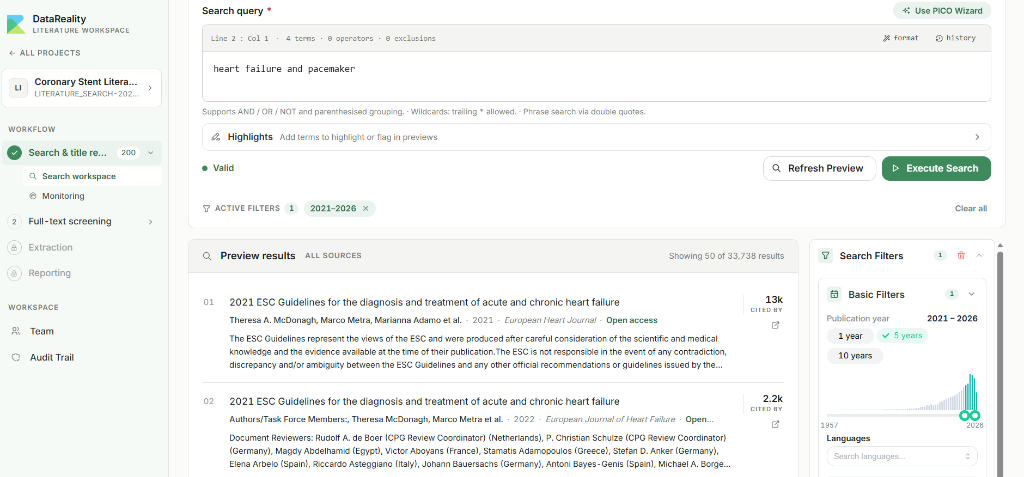
- Modified Query: In this example, the query is expanded to
"heart failure and pacemaker". - Active Filters: Filters like
2021-2026are applied directly to the builder. - Refresh Preview: Click this to see how your modified query and filters affect the results list before running a full execution again.
9. Advanced AI Strategy and L2 Screening
Beyond simple query generation, DataReality offers full-text (L2) screening and advanced strategy building powered by AI.
Generating Queries with DR Assist
Instead of manually crafting boolean strings, you can use natural language.
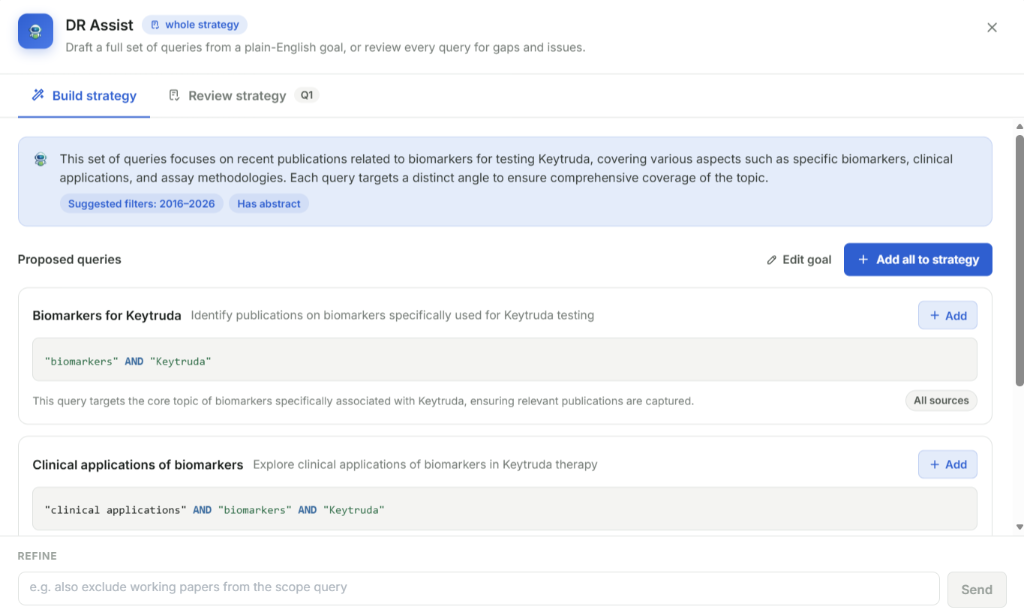
- Goal-Based Drafting: Enter a plain-English goal (e.g., "Find biomarkers for testing Keytruda").
- Proposed Queries: The AI generates a set of discrete boolean queries to cover various angles of your topic, along with suggested filters (e.g.,
2016-2026). - Refinement: Use the chat interface at the bottom to iteratively tweak the generated queries before clicking Add all to strategy.
Managing L2 (Full-Text) Screening
Once Title & Abstract screening is complete, you advance to the L2 Screening phase.
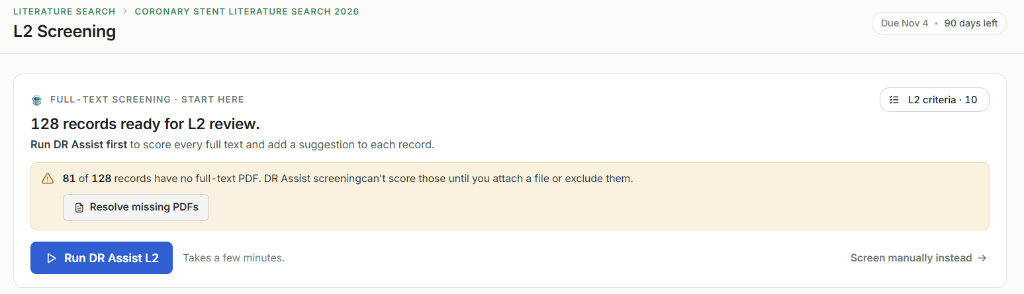
- L2 Criteria: Ensure your full-text inclusion/exclusion rules are defined.
- Missing PDFs Warning: L2 screening requires full texts. If records lack a PDF, a warning banner will prompt you to resolve them before AI scoring can proceed.
Resolving Missing Full Texts
Clicking Resolve missing PDFs opens a management modal.
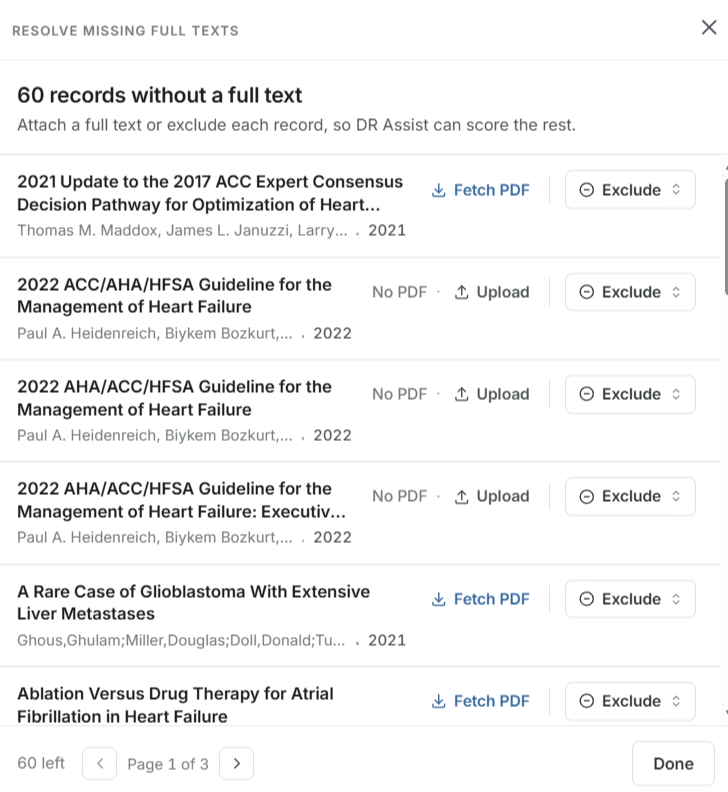
- Fetch PDF: Automatically queries external databases to retrieve open-access or licensed PDFs.
- Upload: If automatic fetching fails, you can manually upload the PDF file from your local machine.
- Exclude: If a full text is permanently irretrievable, you can choose to exclude the record at this stage.
Initiating DR Assist L2
With PDFs attached, you can manage and execute full-text screening.
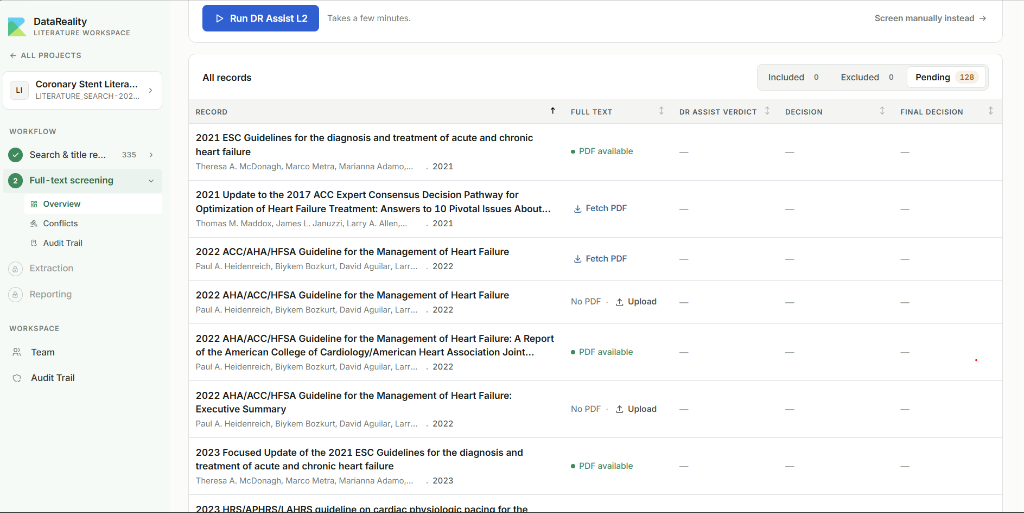
- Full Text Status: The record list shows clear indicators like
PDF available,Fetch PDF, orNo PDF • Upload. - DR Assist Verdict Column: Displays the AI's confidence and suggestion once screening is initiated.
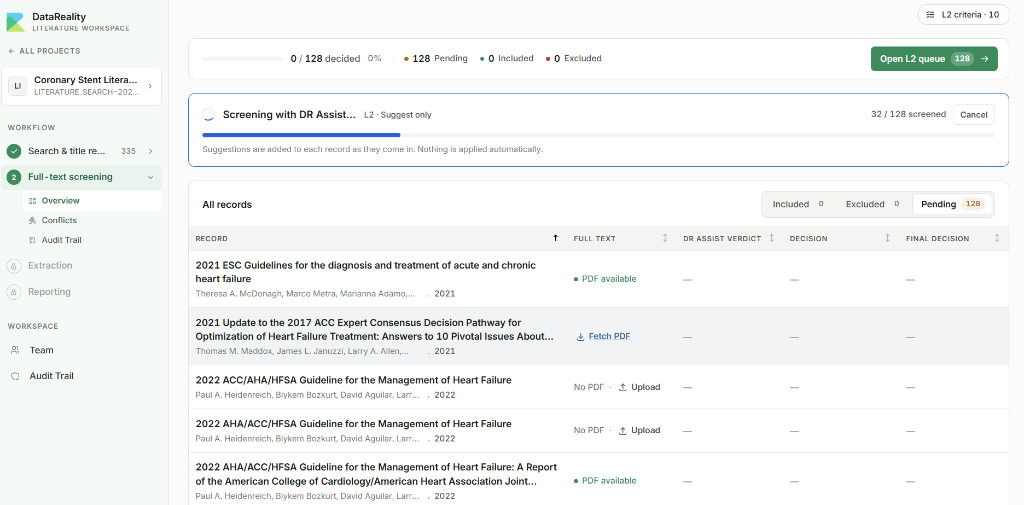
- Run DR Assist L2: Clicking this button starts the AI full-text reading process. A progress bar tracks completion across all pending records.
- Open L2 Queue: Allows you to jump into manual review alongside the AI, approving or rejecting its suggestions sequentially.
10. Manual L2 Screening and Data Extraction
If you prefer to review literature without AI assistance or need to verify the AI's suggestions, the manual interface provides a robust reading environment.
Manual Screening Interface
You can bypass the AI entirely if desired.

- Screen manually instead: Clicking this link skips the AI processing and opens your unreviewed records directly in the reading queue.
Once in the queue, you can choose between a focused modal or a full-page reading experience.
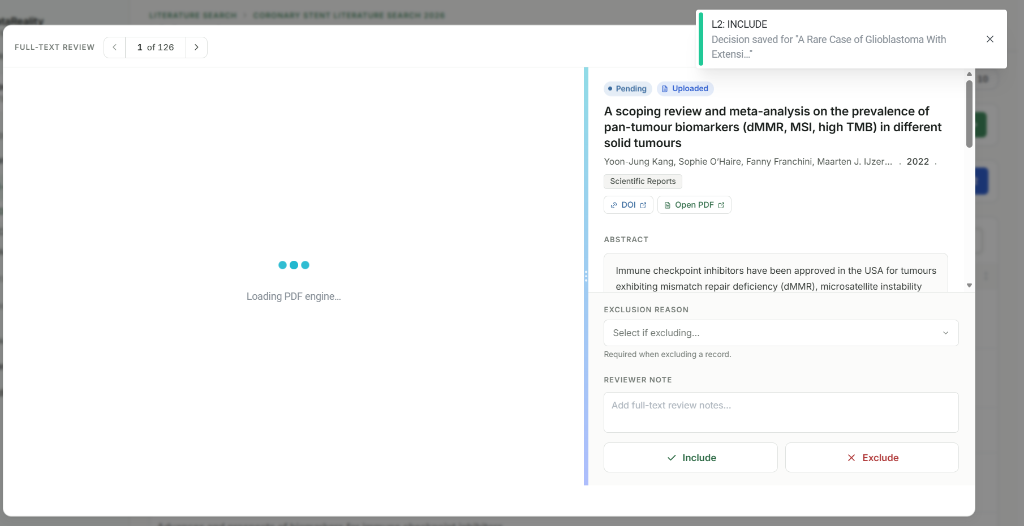
- Modal Review: A quick pop-up interface where the PDF loads dynamically on the left while the screening form remains anchored on the right.
- Top Navigation: Use the arrows (e.g.,
1 of 126) to quickly page through the queue without closing the window.
For complex papers, the full-screen side-by-side view is recommended.
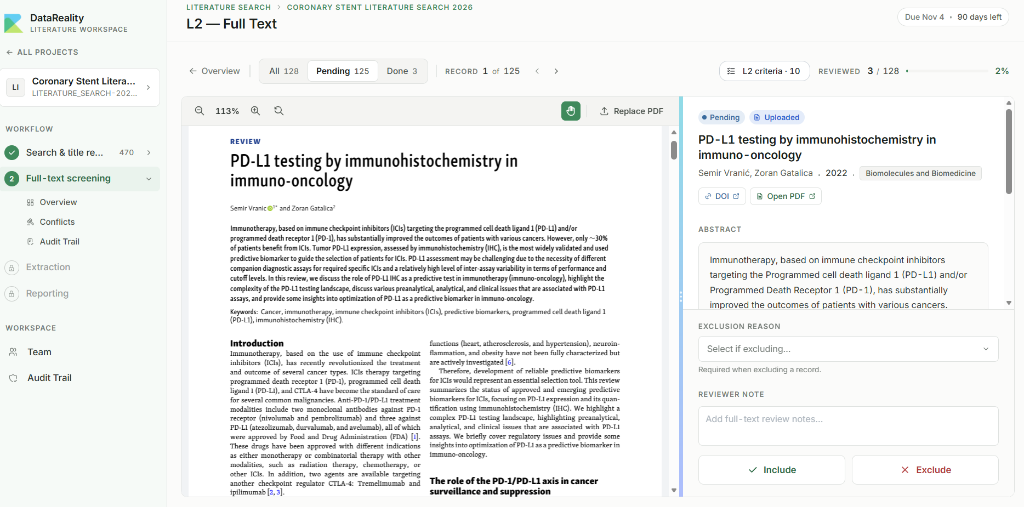
- Integrated PDF Reader (Left): A fully featured document viewer with zoom and search capabilities.
- Screening Form (Right): Contains the paper's metadata (DOI, Abstract).
- Exclusion Reason: A required dropdown field when rejecting a paper at the full-text stage.
- Reviewer Note: An optional text field for logging specific justifications or flags for your team.
- Decision Buttons: Click Include or Exclude to log your decision and automatically advance to the next paper.
Unlocking Data Extraction
Once every record has a final decision, the phase can be closed.
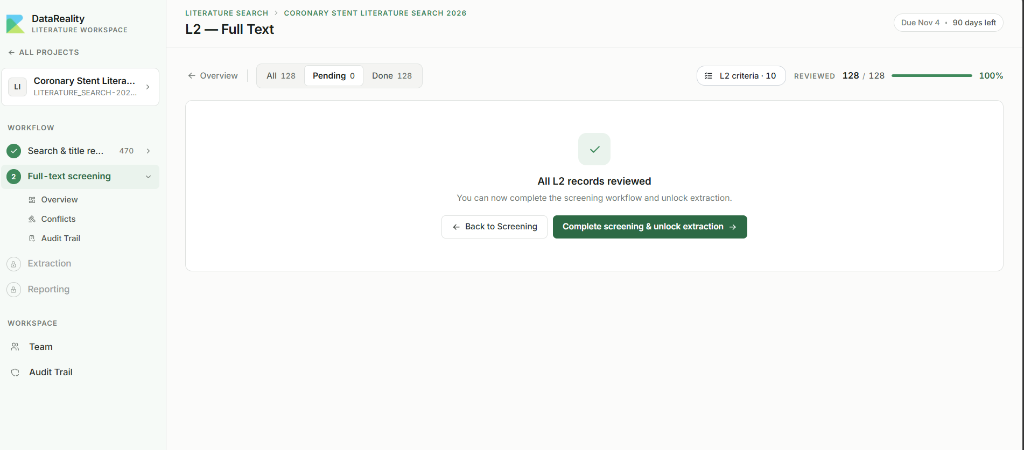
- Completion Screen: The system will display "All L2 records reviewed".
- Unlock Extraction: Click Complete screening & unlock extraction to finalize the PRISMA diagram and move your included papers into the final data extraction stage.
The Extraction Dashboard
The final stage of the workflow involves pulling specific data points from your included literature.
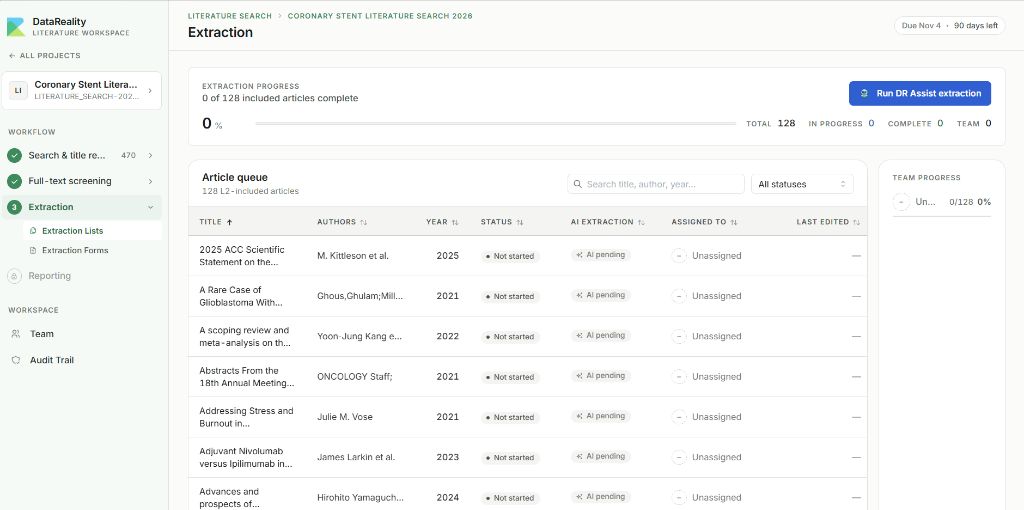
- Extraction Progress: A high-level tracking bar showing the percentage of articles fully extracted.
- Article Queue: Lists all successfully included papers from L2, showing their current status (e.g.,
Not started). - AI Extraction: You can click Run DR Assist extraction to have the AI automatically pull the required data points into your extraction forms, saving hours of manual data entry.
11. Data Extraction and Form Building
Once you begin processing individual articles for extraction, the interface expands to handle structured data capture.
The Extraction Interface
Clicking into an article opens the dual-pane extraction view.
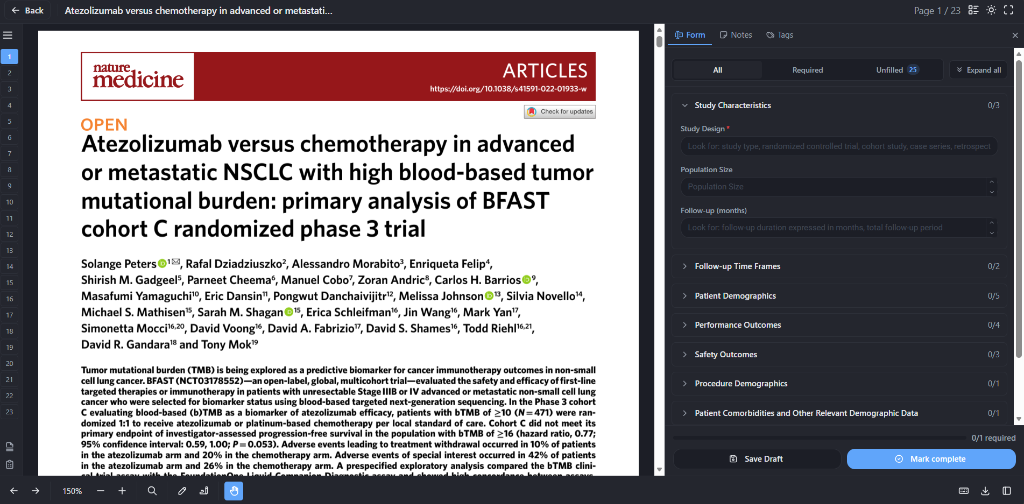
- PDF Reader (Left): The full-text article remains accessible for reference.
- Form Tab (Right): Displays your customized extraction fields categorized into sections (e.g., Study Characteristics, Patient Demographics).
- Mark Complete: Once all required fields (marked in red) are filled, click this button to finalize the article and return to the queue.
PDF Annotations and Linking
You can directly interact with the text in the PDF to capture data or leave notes.
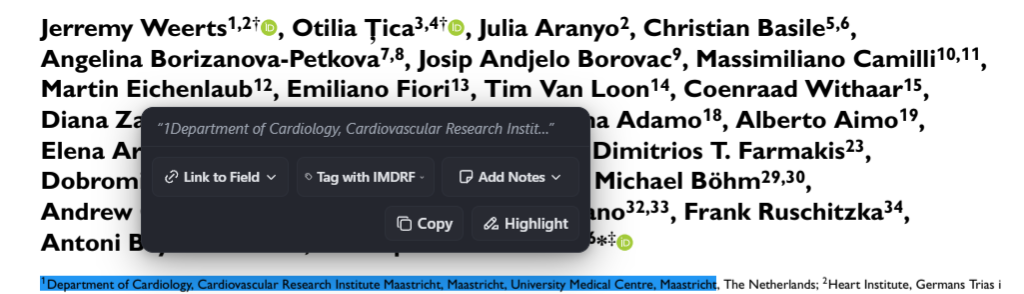
- Context Menu: Highlighting any text in the PDF triggers a pop-up menu.
- Link to Field: Pulls the highlighted text directly into one of your form fields on the right, creating a verifiable link back to the exact sentence in the document.
- Other Actions: You can also manually add a note, copy the text, or simply apply a visual highlight for later review.
Notes and Traceability
For collaborative projects, leaving structured notes is crucial.
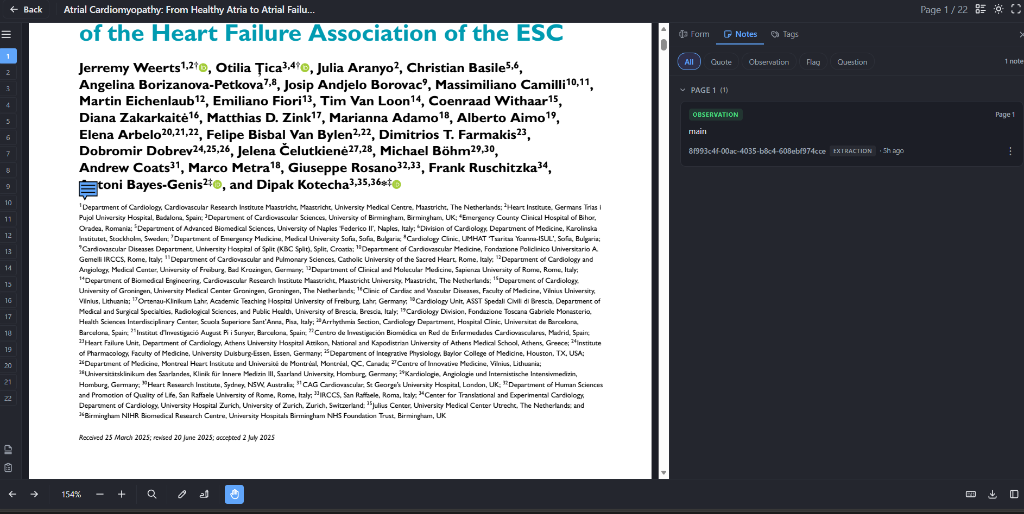
- Notes Tab: Switches the right panel from the Form to the Notes view.
- Observations and Flags: Reviewers can drop targeted observations, quotes, flags, or questions. These are visibly pinned to the highlighted text in the PDF.
Adverse Event Tagging (IMDRF)
If your project requires vigilance reporting, you can utilize standardized taxonomy tags.
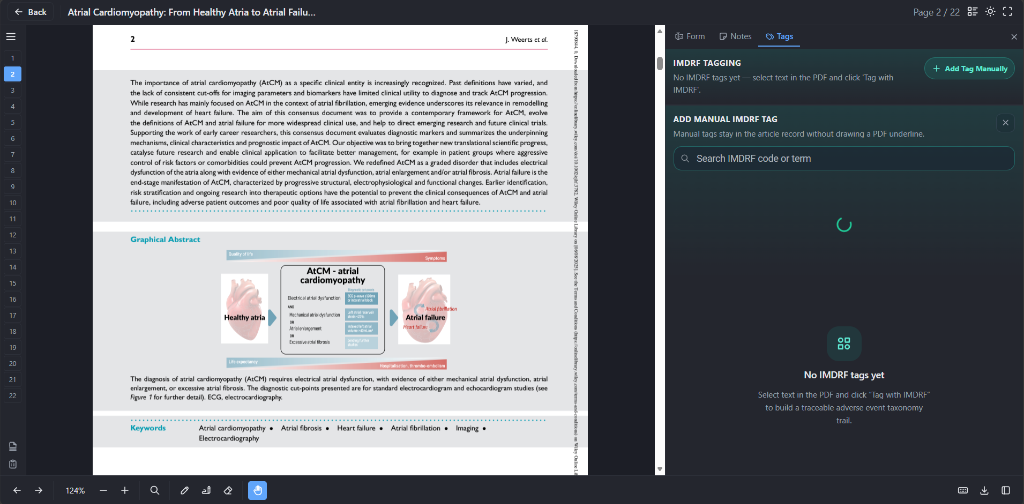
- Tags Tab: Designed specifically for IMDRF (International Medical Device Regulators Forum) tagging.
- Traceable Taxonomy: Selecting text in the PDF and choosing Tag with IMDRF builds a traceable adverse event taxonomy trail required for clinical evaluation reports.
Customizing the Form Builder
Before starting extraction, you must define exactly what data you need to collect.
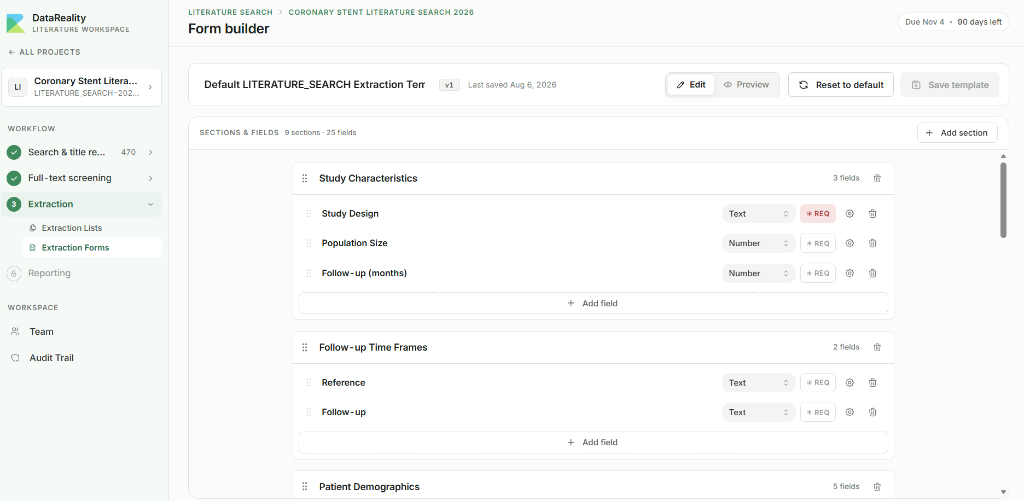
- Extraction Forms (Left Menu): Accessed from the main workflow navigation.
- Drag-and-Drop Builder: A flexible UI allowing you to define sections and individual fields.
- Field Settings: You can specify field types (Text, Number, Dropdown) and mark specific fields as
*REQ(Required) to ensure critical data is never missed by your team or the AI.
12. Finalizing Extraction and Generating Reports
Once all data is extracted, the final step is to generate your compliant evaluation reports.
Completing the Extraction Phase
When your Extraction Progress hits 100%, you can lock the phase.
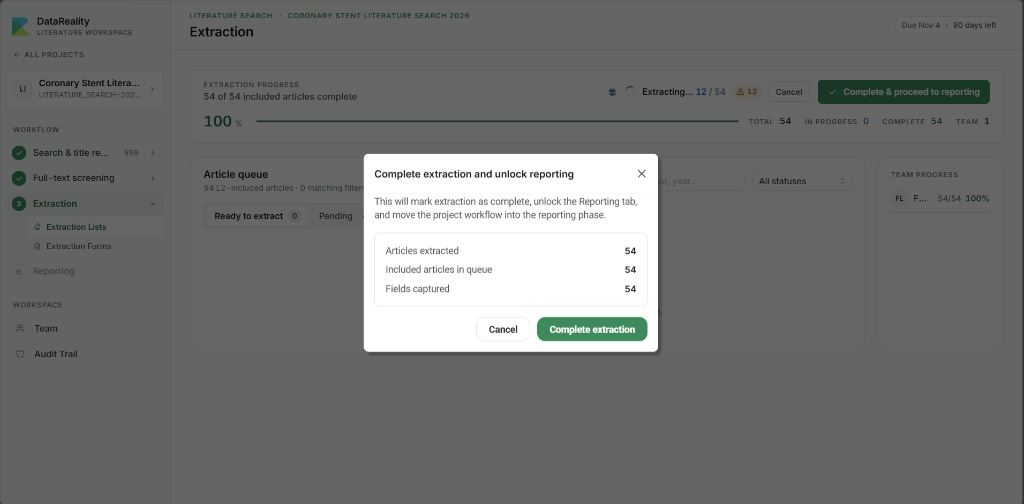
- Complete & proceed to reporting: Clicking this button from the extraction dashboard brings up a confirmation modal.
- Verification Summary: The modal verifies that the number of articles extracted matches the included articles in the queue, ensuring no missing data.
- Complete extraction: Click this to lock the extraction data and permanently unlock the Reporting tab.
The Report Generator
The Reporting dashboard is where you assemble the final audit record.
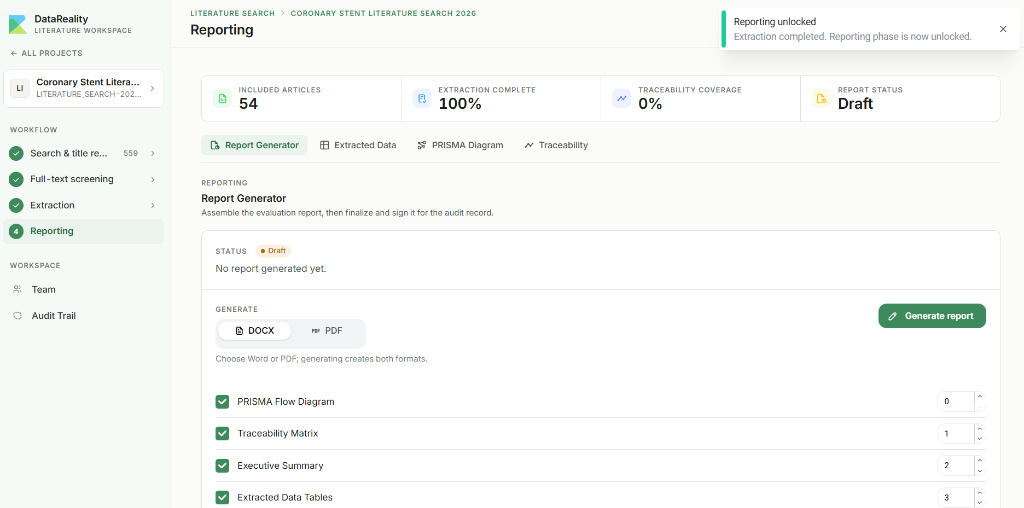
- Report Format: Choose your desired output format, such as
DOCXorPDF. - Report Sections: Check the boxes for the specific components you want included in your export (e.g., PRISMA Flow Diagram, Traceability Matrix, Executive Summary, Extracted Data Tables).
- Generate report: Click this button to compile the selected data into a single, comprehensive document.
Finalizing and Signing the Report
After generation, the report must be formally signed.
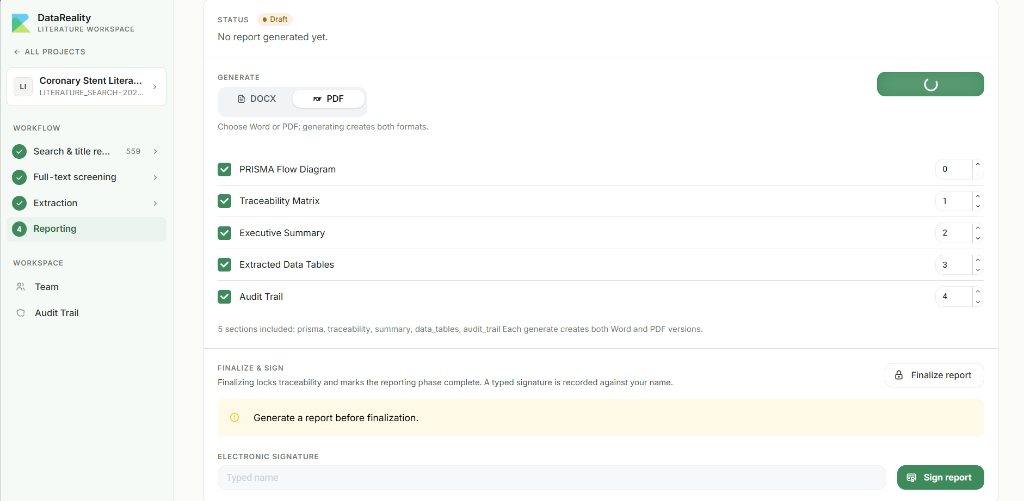
- Finalize report: This action locks the traceability matrices and marks the entire literature search project as complete.
- Electronic Signature: You are required to type your name into the signature field and click Sign report to create a compliant, time-stamped audit trail against your user account.
Verifying Extracted Data Coverage
Before generating reports, you can verify data completeness visually.
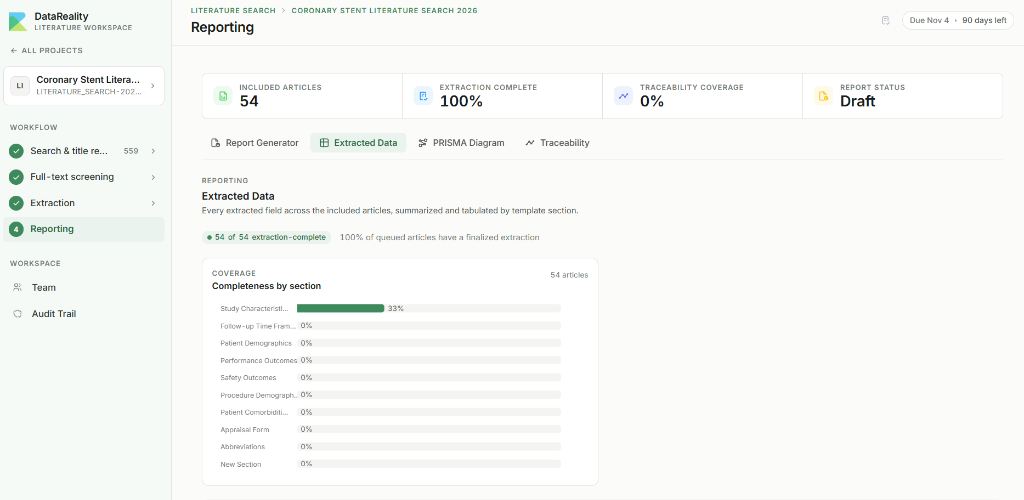
- Extracted Data Tab: Located in the Reporting dashboard, this view summarizes every extracted field across all included articles.
- Completeness by Section: A visual bar chart showing the coverage percentage for each section of your extraction template, helping you spot if certain data points (like Study Characteristics or Safety Outcomes) were consistently missing from your literature pool.
PRISMA Flow Diagram and Validation
The system automatically generates a compliant PRISMA 2020 Flow Diagram as you progress.
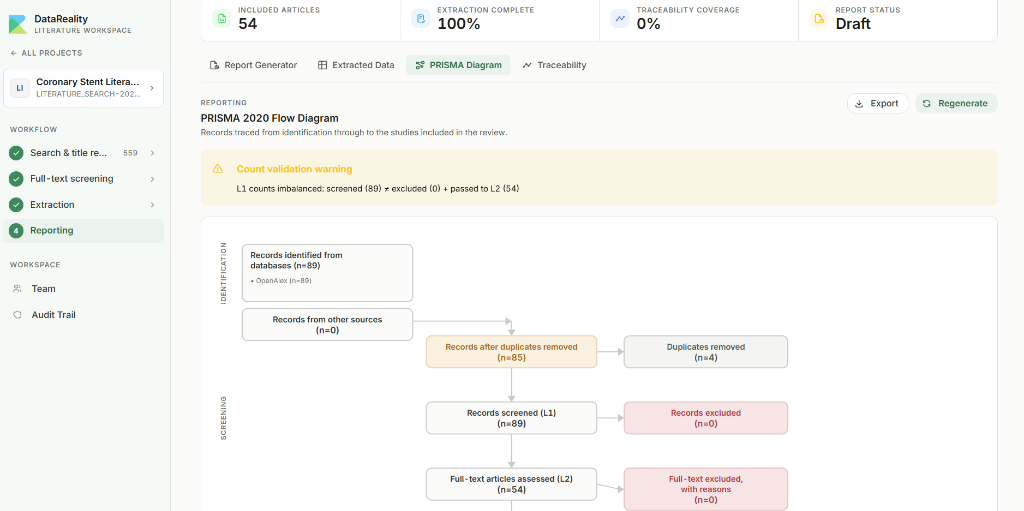
- PRISMA Diagram Tab: Visualizes the flow of records from identification through screening to final inclusion.
- Count Validation Warning: If system states become desynchronized (e.g., L1 screened counts don't precisely equal excluded plus passed), a yellow warning banner appears to ensure scientific integrity is maintained before reporting.
The Traceability Matrix
For clinical evaluations, every claim must be traced back to its source.
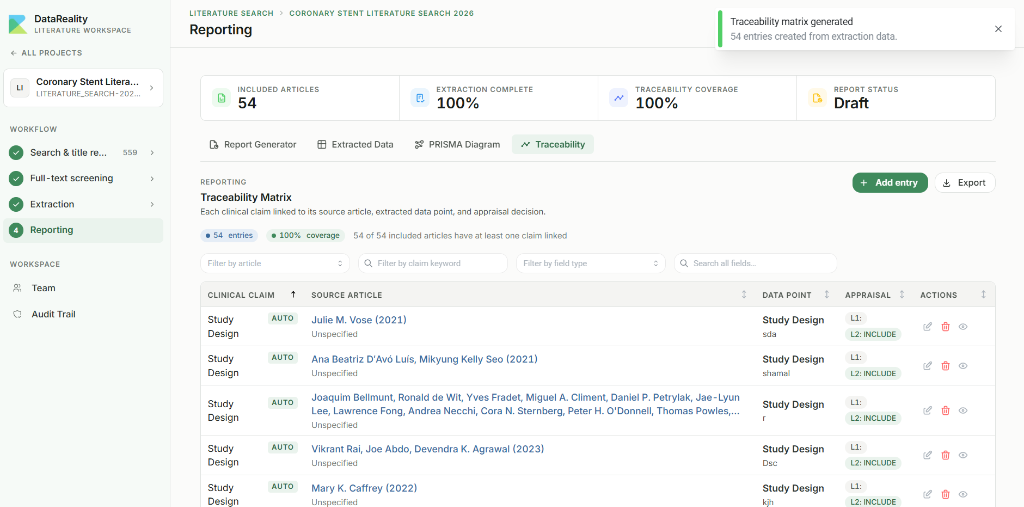
- Traceability Matrix Tab: Provides a comprehensive table linking every Clinical Claim to its Source Article, specific Data Point, and Appraisal decision.
- Coverage Metrics: At the top, you can verify that 100% of your included articles have at least one claim linked.
Reporting Requirements and Finalization
As a regulatory tool, DataReality enforces strict workflows to maintain audit integrity.

- Locked Finalization: You cannot finalize a project blindly. The Finalize report button remains locked with a warning stating: "Generate a report before finalization." You must generate and review the output first.
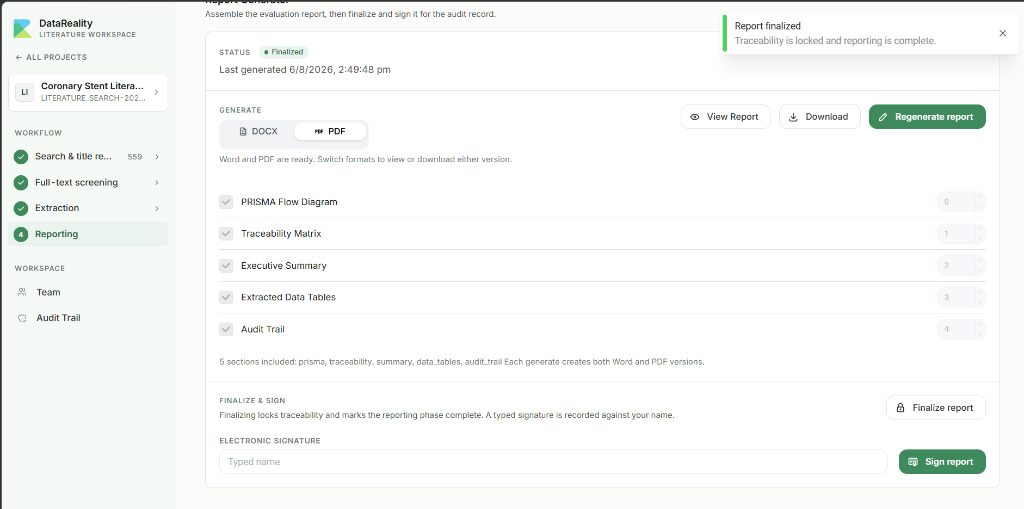
- Report Finalized: Once signed, a green success banner confirms that traceability is locked. No further changes can be made to the search, screening, or extraction phases.
13. Team Collaboration
Literature reviews are rarely solo endeavors. DataReality supports collaborative workflows out of the box.
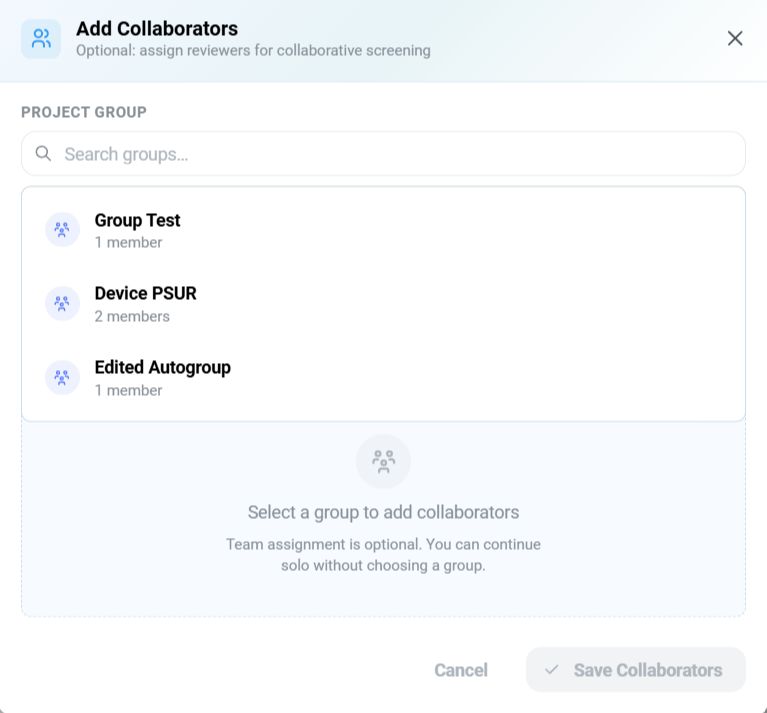
- Project Groups: Clicking Team in the left workspace menu opens the Add Collaborators modal.
- Assign Reviewers: You can select predefined user groups (e.g., Device PSUR) to assign multiple reviewers to a project, enabling collaborative screening and distributed data extraction workloads.
14. Regulatory Compliance and Audit Logs
Because DataReality is built for rigorous clinical evaluation workflows, every action you take is permanently logged.
Comprehensive Audit Trail
To view the history of your project, you can access the system's tracking logs.
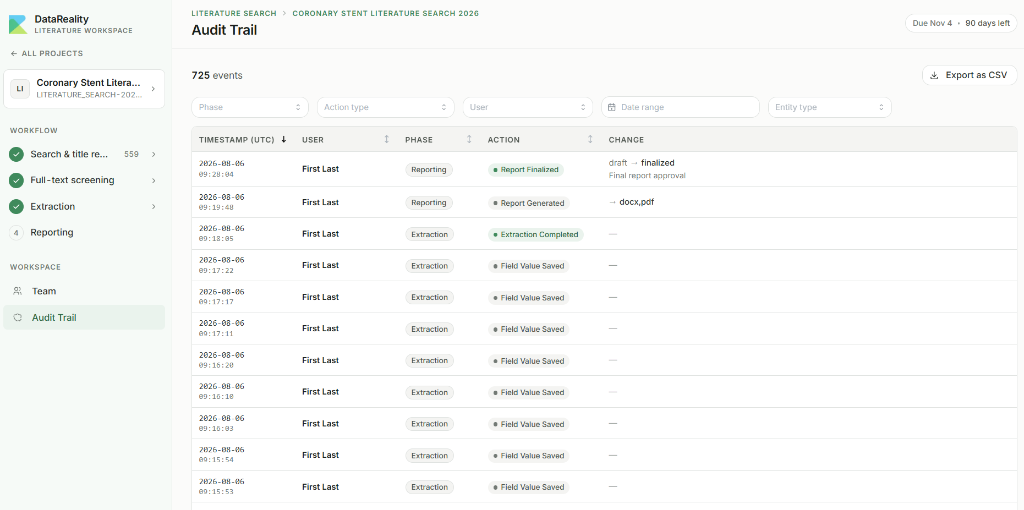
- Audit Trail Menu: Accessed from the bottom left of the workspace navigation.
- Event Log: Displays a detailed history of every interaction (e.g., Field Value Saved, Report Generated, Report Finalized).
- Data Points: Logs the exact Timestamp (UTC), User, Phase, Action, and the specific Change that occurred.
- Export: You can click Export as CSV to download the complete log for inclusion in your regulatory submission files.
Verifiable Electronic Signatures
The final step in securing this audit trail is the electronic signature.

- Finalize & Sign: Located at the bottom of the Reporting dashboard.
- Typed Name: You must explicitly type your name into the Electronic Signature field.
- Sign Report: Once your name is entered, the Sign report button becomes active. Clicking this binds your user identity to the finalized report and logs the final
draft → finalizedapproval event permanently into the Audit Trail.
Reviewing the Downloaded Output
The finalized report is delivered directly to your device.
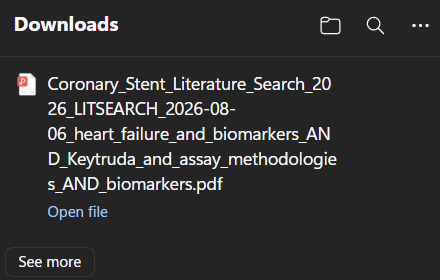
- Downloaded File: The generated PDF or DOCX file will appear in your browser's downloads folder.
- File Naming Convention: The system automatically applies a standardized naming convention containing the project name, date, and core query string for easy filing.
Once you open the generated file, you will find a fully structured regulatory document ready for submission.
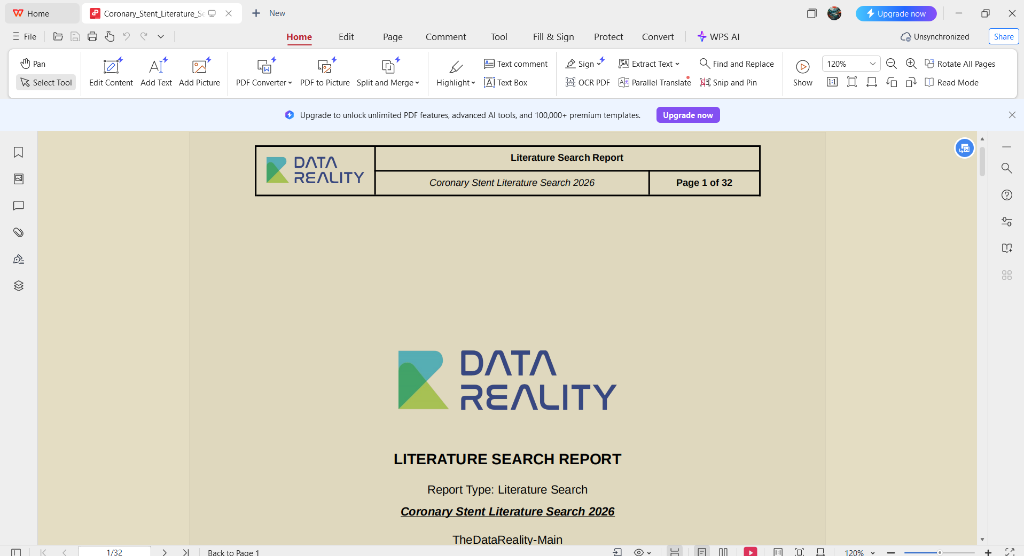
- Cover Page: Displays the report type, the overarching project title, and formal branding, ensuring immediate compliance with formatting standards.
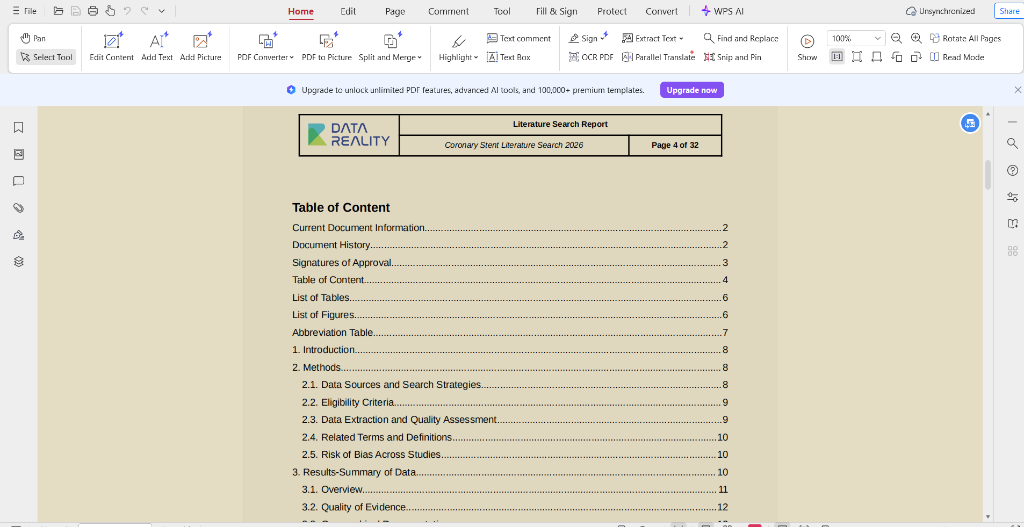
- Table of Contents: An auto-generated, clickable index that structures the report into standardized sections like Document History, Introduction, Methods, and Results.
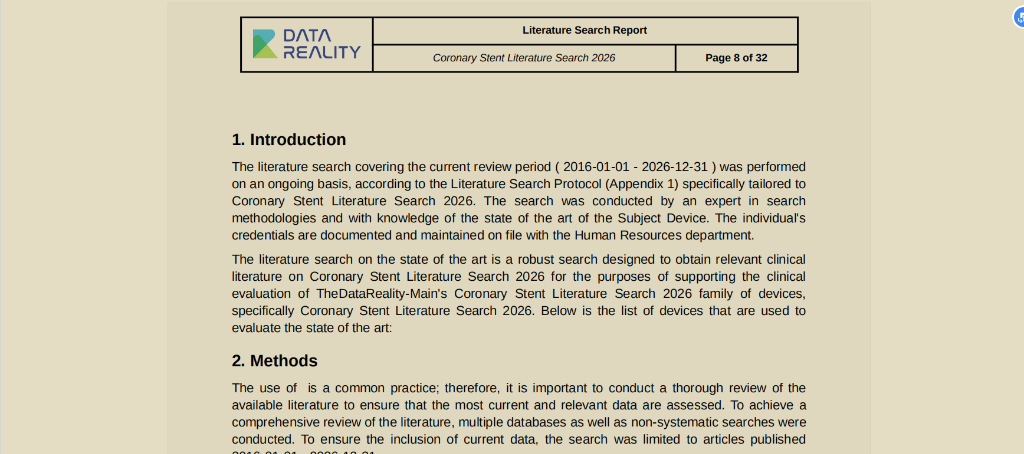
- Narrative Generation: Based on your initial protocol, the system automatically drafts the Introduction and Methods sections to describe the precise search strategies and eligibility criteria used.
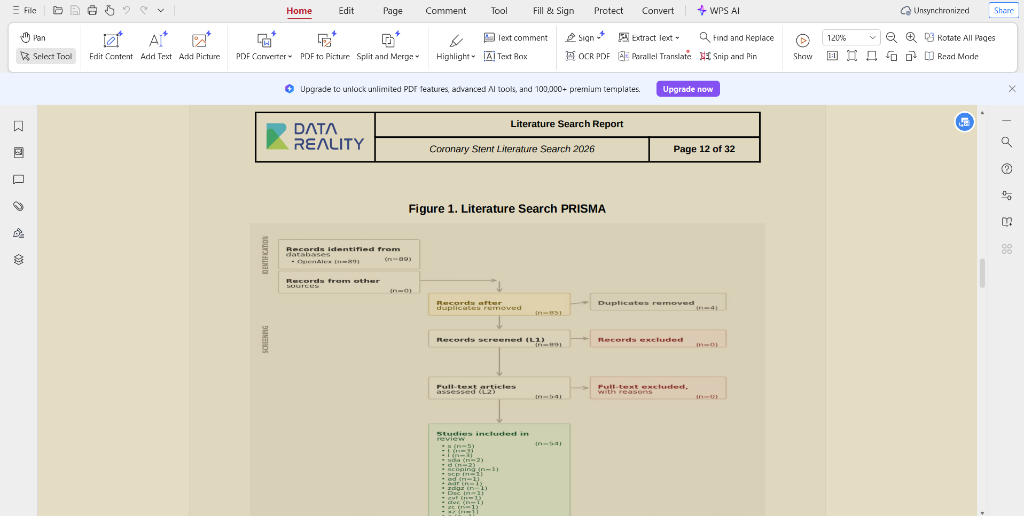
- Embedded PRISMA: The validated flow diagram from your workspace is seamlessly embedded into the document as a high-resolution figure, serving as the official record of your screening funnel.
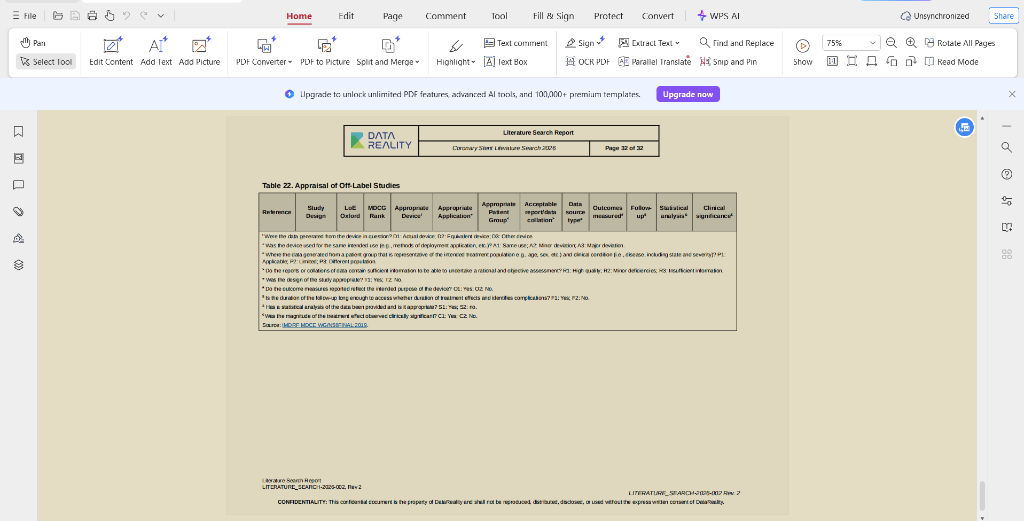
- Data Tables: Finally, all of your extraction work is formatted into clean, readable tables appended to the end of the report, complete with all taxonomy footnotes and definitions.